LabPlot 2.12 released
Welcome LabPlot 2.12!
After many months of intense work, we are proud to announce the new release of LabPlot 2.12, a FREE, open source and cross-platform Data Visualization and Analysis software accessible to everyone and trusted by professionals!
This latest release introduces a wealth of new features, enhancements, and performance improvements across various areas. It also expands support for additional data formats and visualization types.
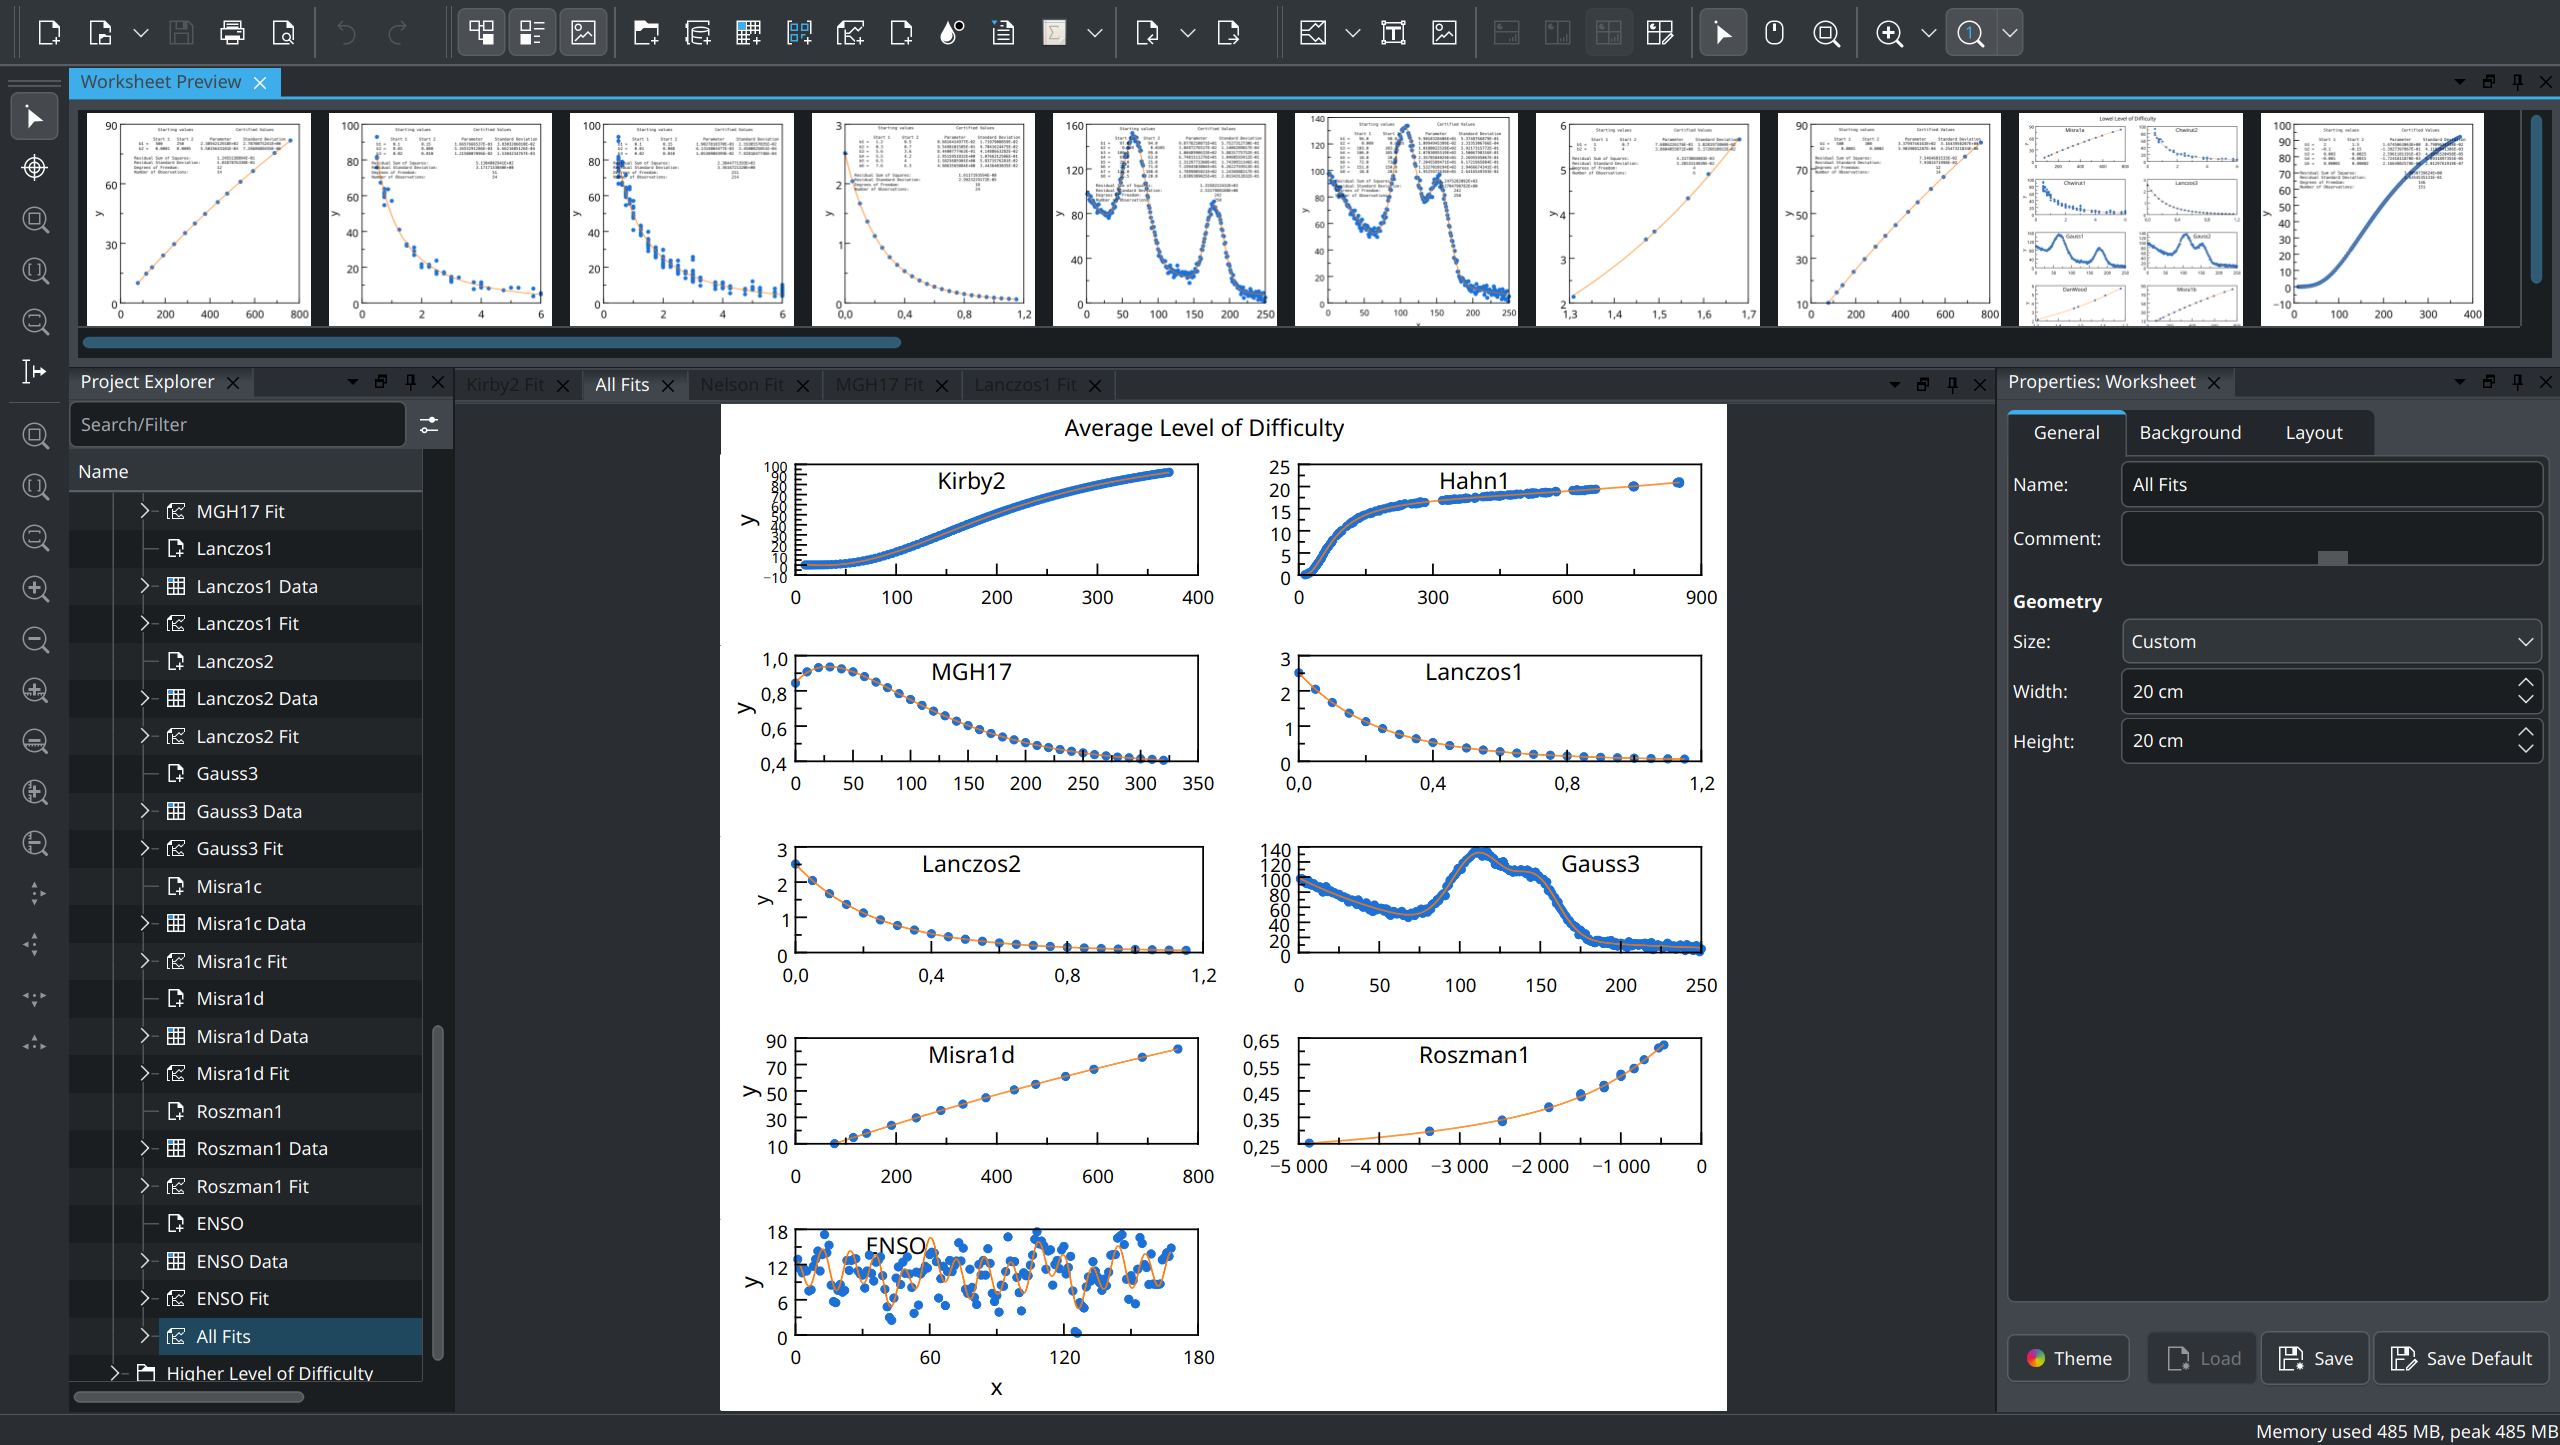
In order to further validate the accuracy of implemented routines, we have also created new example projects that successfully use LabPlot’s nonlinear regression fitting routine to reproduce the certified results for the numerous datasets of varying difficulty provided by specialized divisions of NIST. See https://www.itl.nist.gov/div898/strd/nls/nls_info.shtml for more information about this project and the datasets.
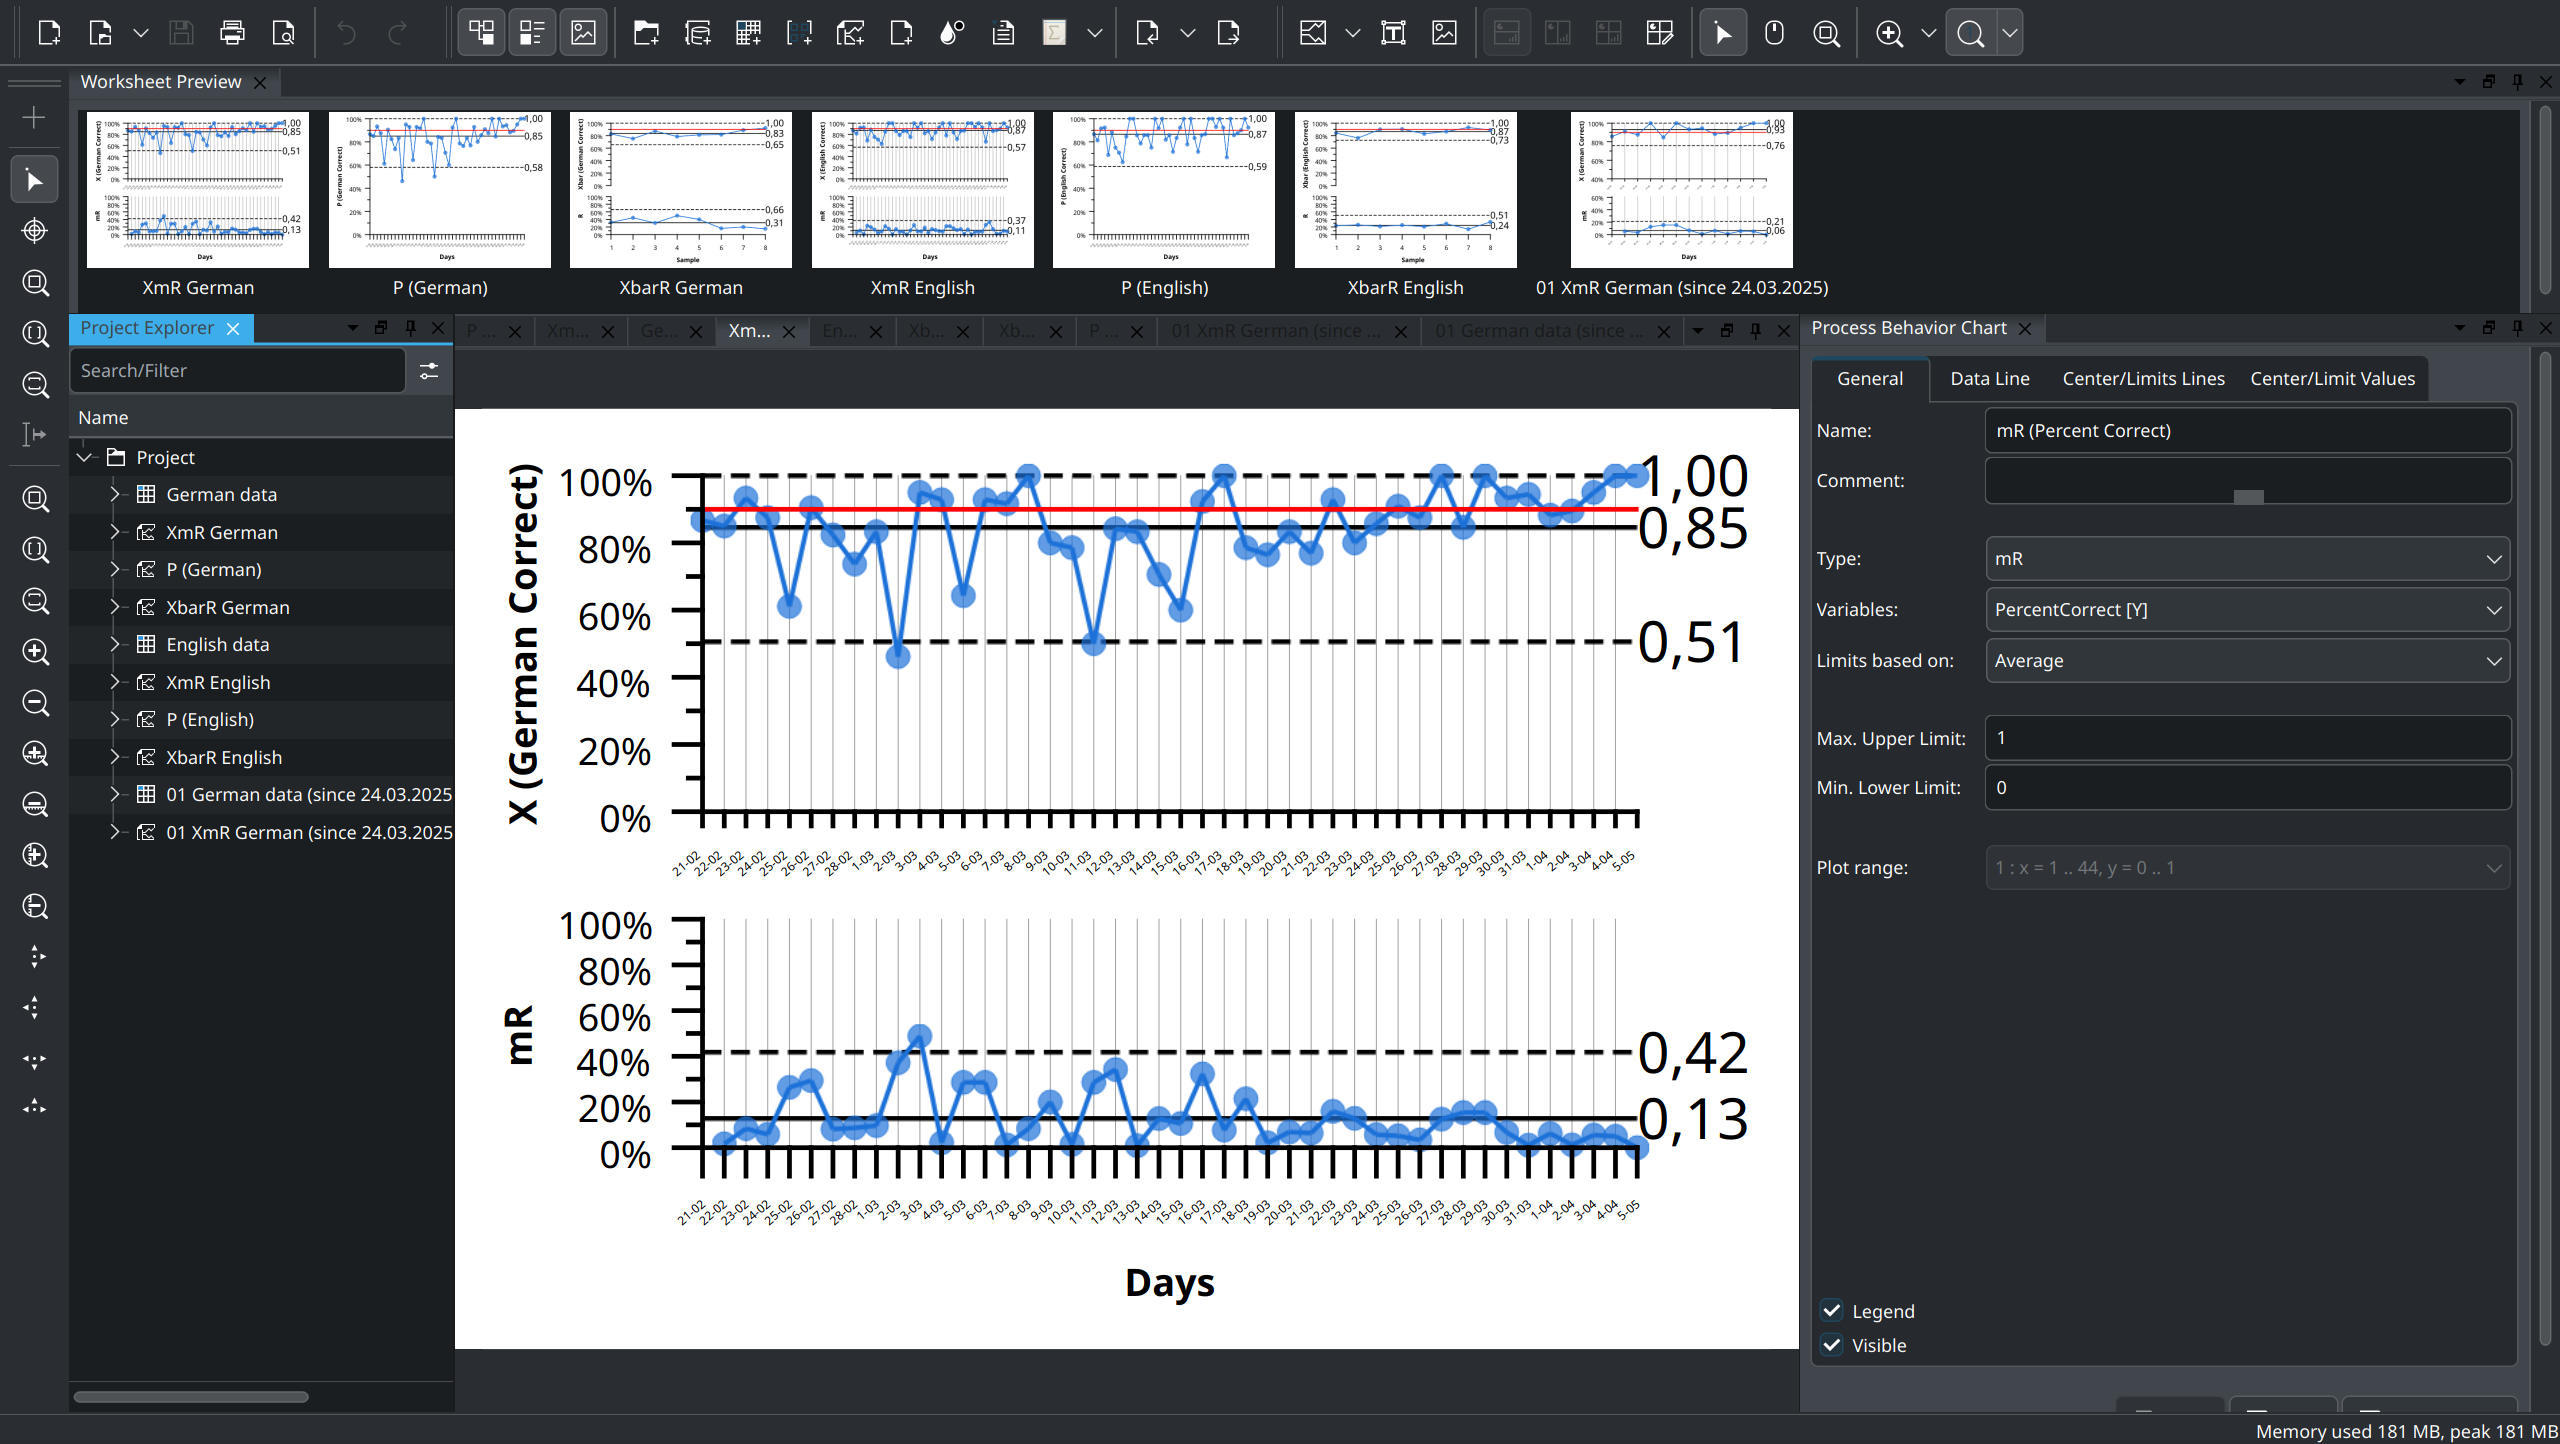
Another new example project is related to the practical usage and the validity of results of Process Behavior Charts (also known as Control Charts or Shewhart Charts) that we introduced in this release. All the example projects are easily available through the “File > Open Example” menu entry in LabPlot.
As we have mentioned elsewhere, we have recently decided to update LabPlot’s documentation and move it to a new format. The new user manual is available on its own dedicated page: https://docs.labplot.org.
Key highlights of this release are summarized below. For a more comprehensive list of changes, please consult the ChangeLog file.
The source code for LabPlot, along with Flatpak, AppImage and Snap packages for Linux, the Windows installer, and the macOS image, can be downloaded from the Download page.
If you have found LabPlot useful in your work, research, or company, consider supporting the project in any of the ways described in the Support section.
This project is partly funded by the NGI0 Core Fund, a fund established by NLnet with financial support from the European Commission’s Next Generation Internet Program, under the aegis of DG Communications Networks, Content and Technology, under Grant Agreement No. 101092990.
What’s new in 2.12?
Worksheet
This release includes more visualizations and usability improvements:
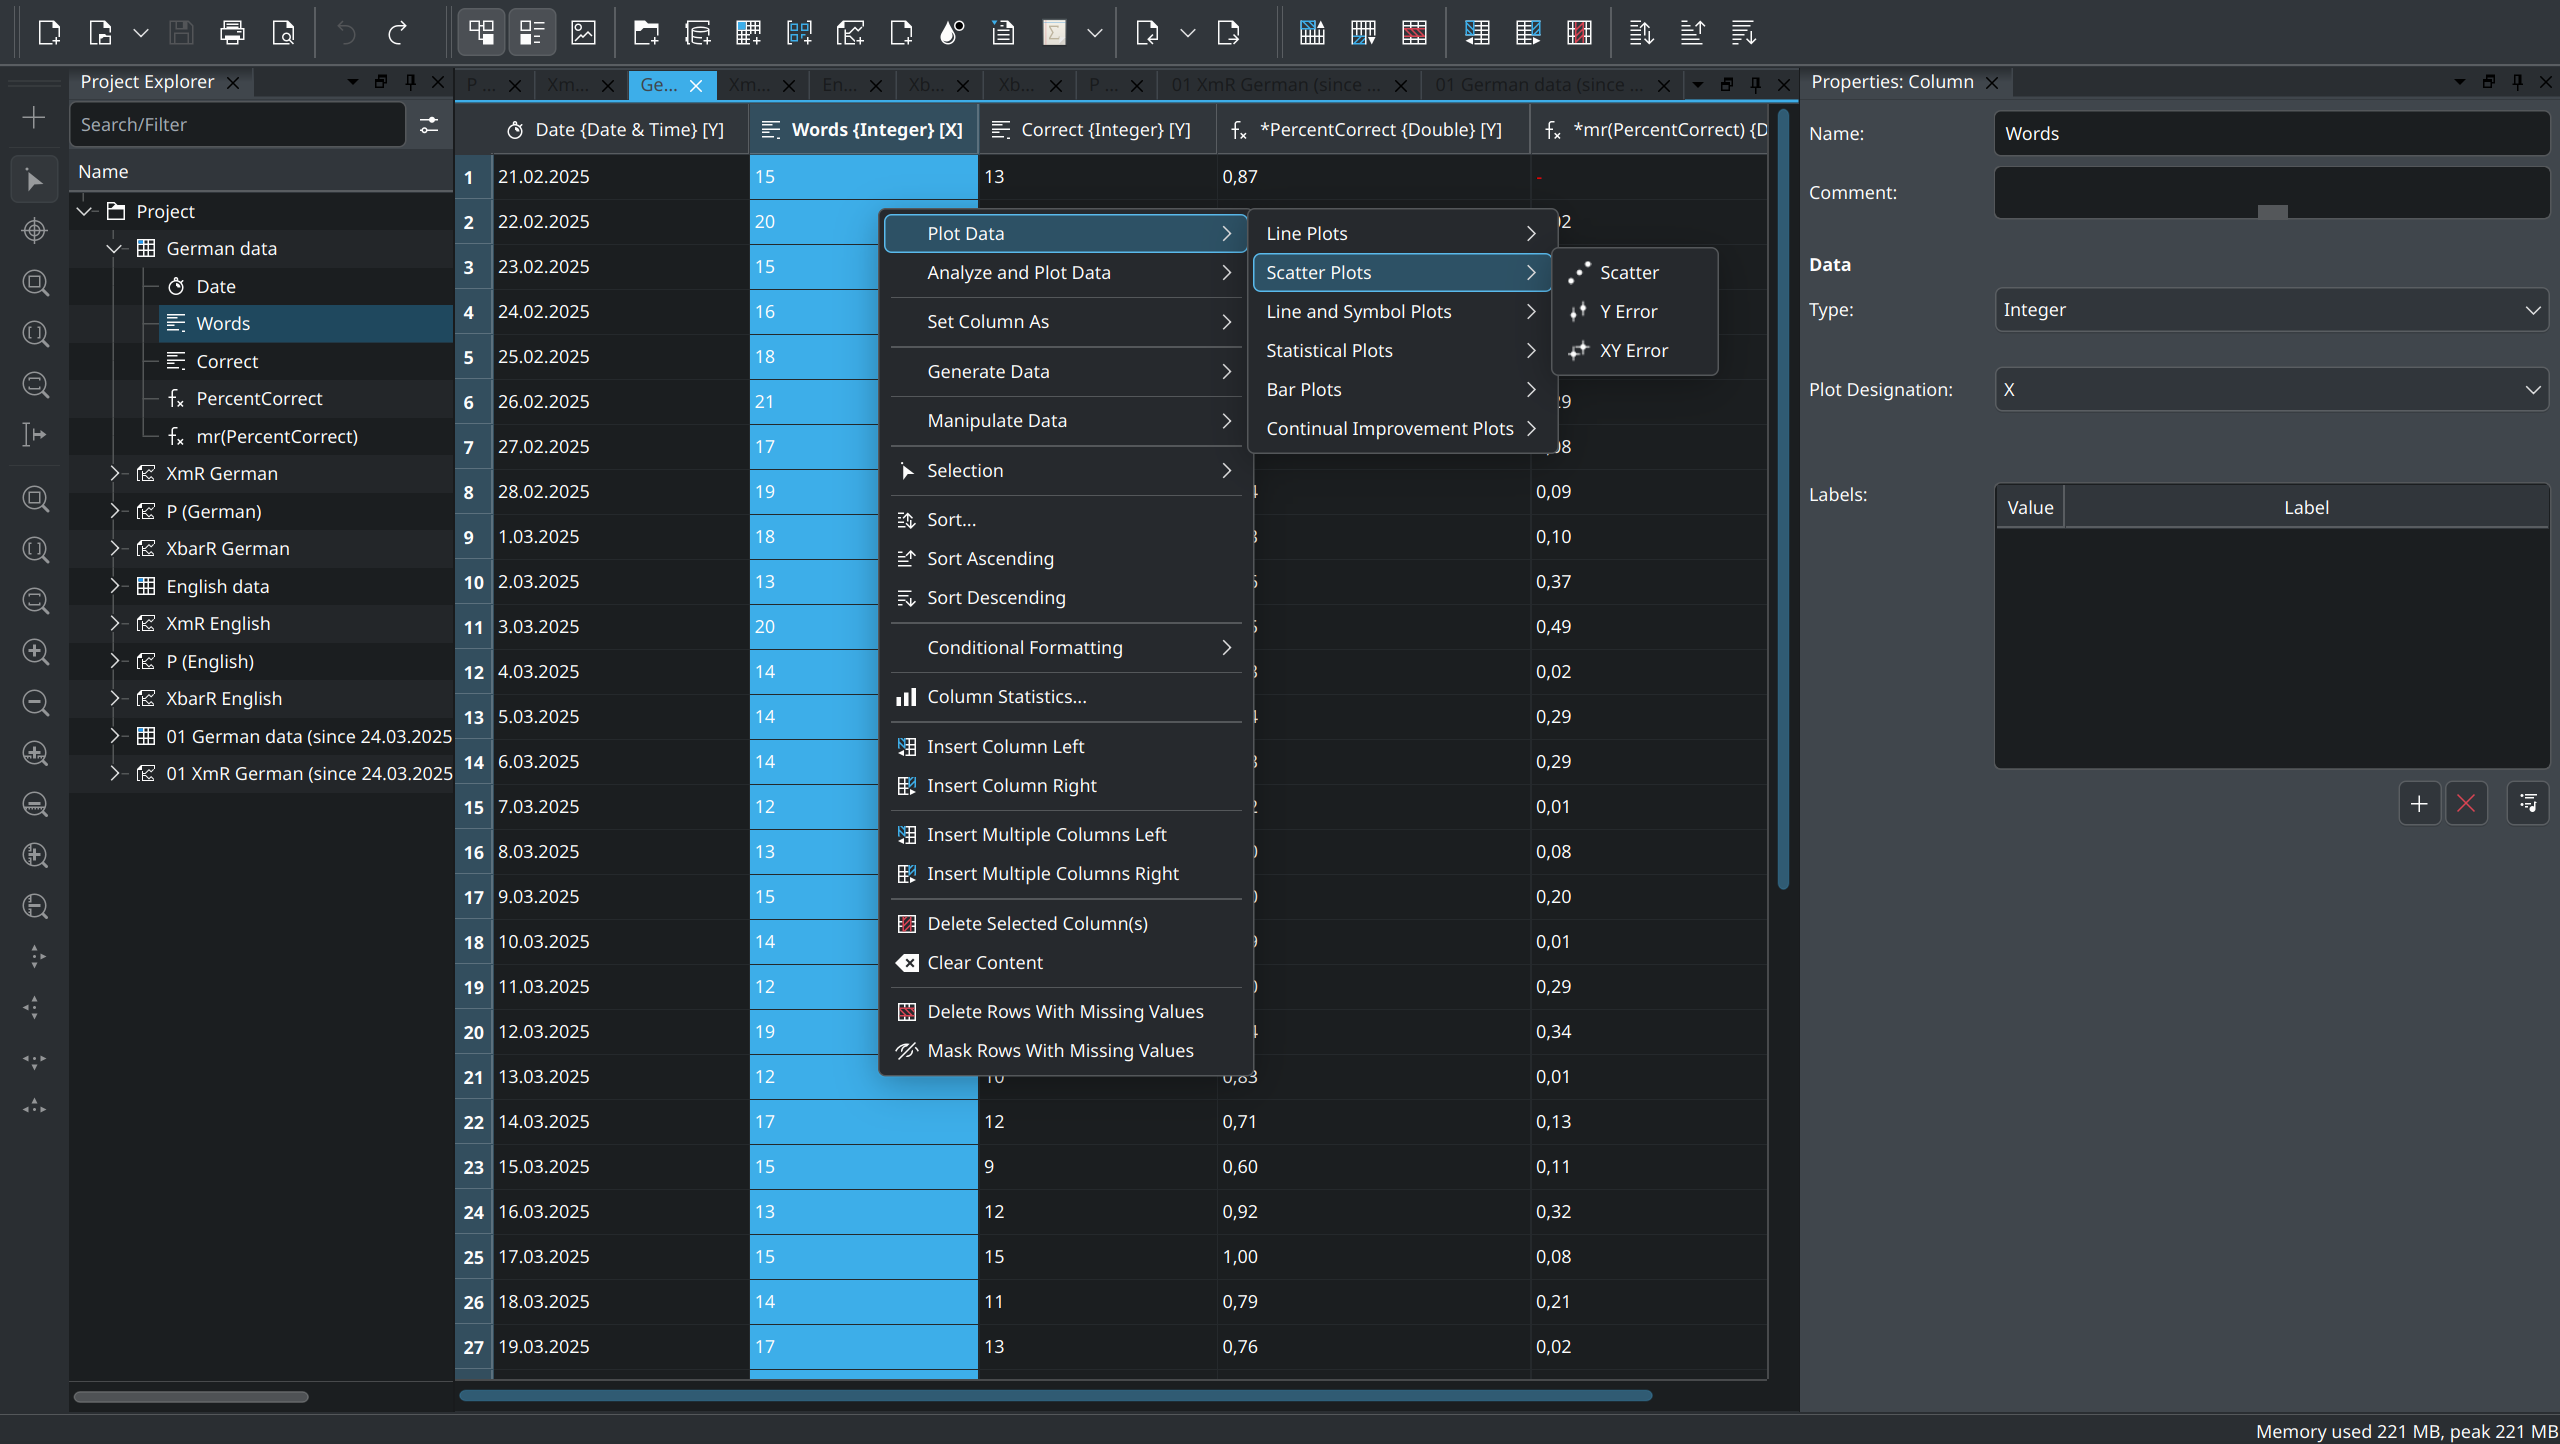
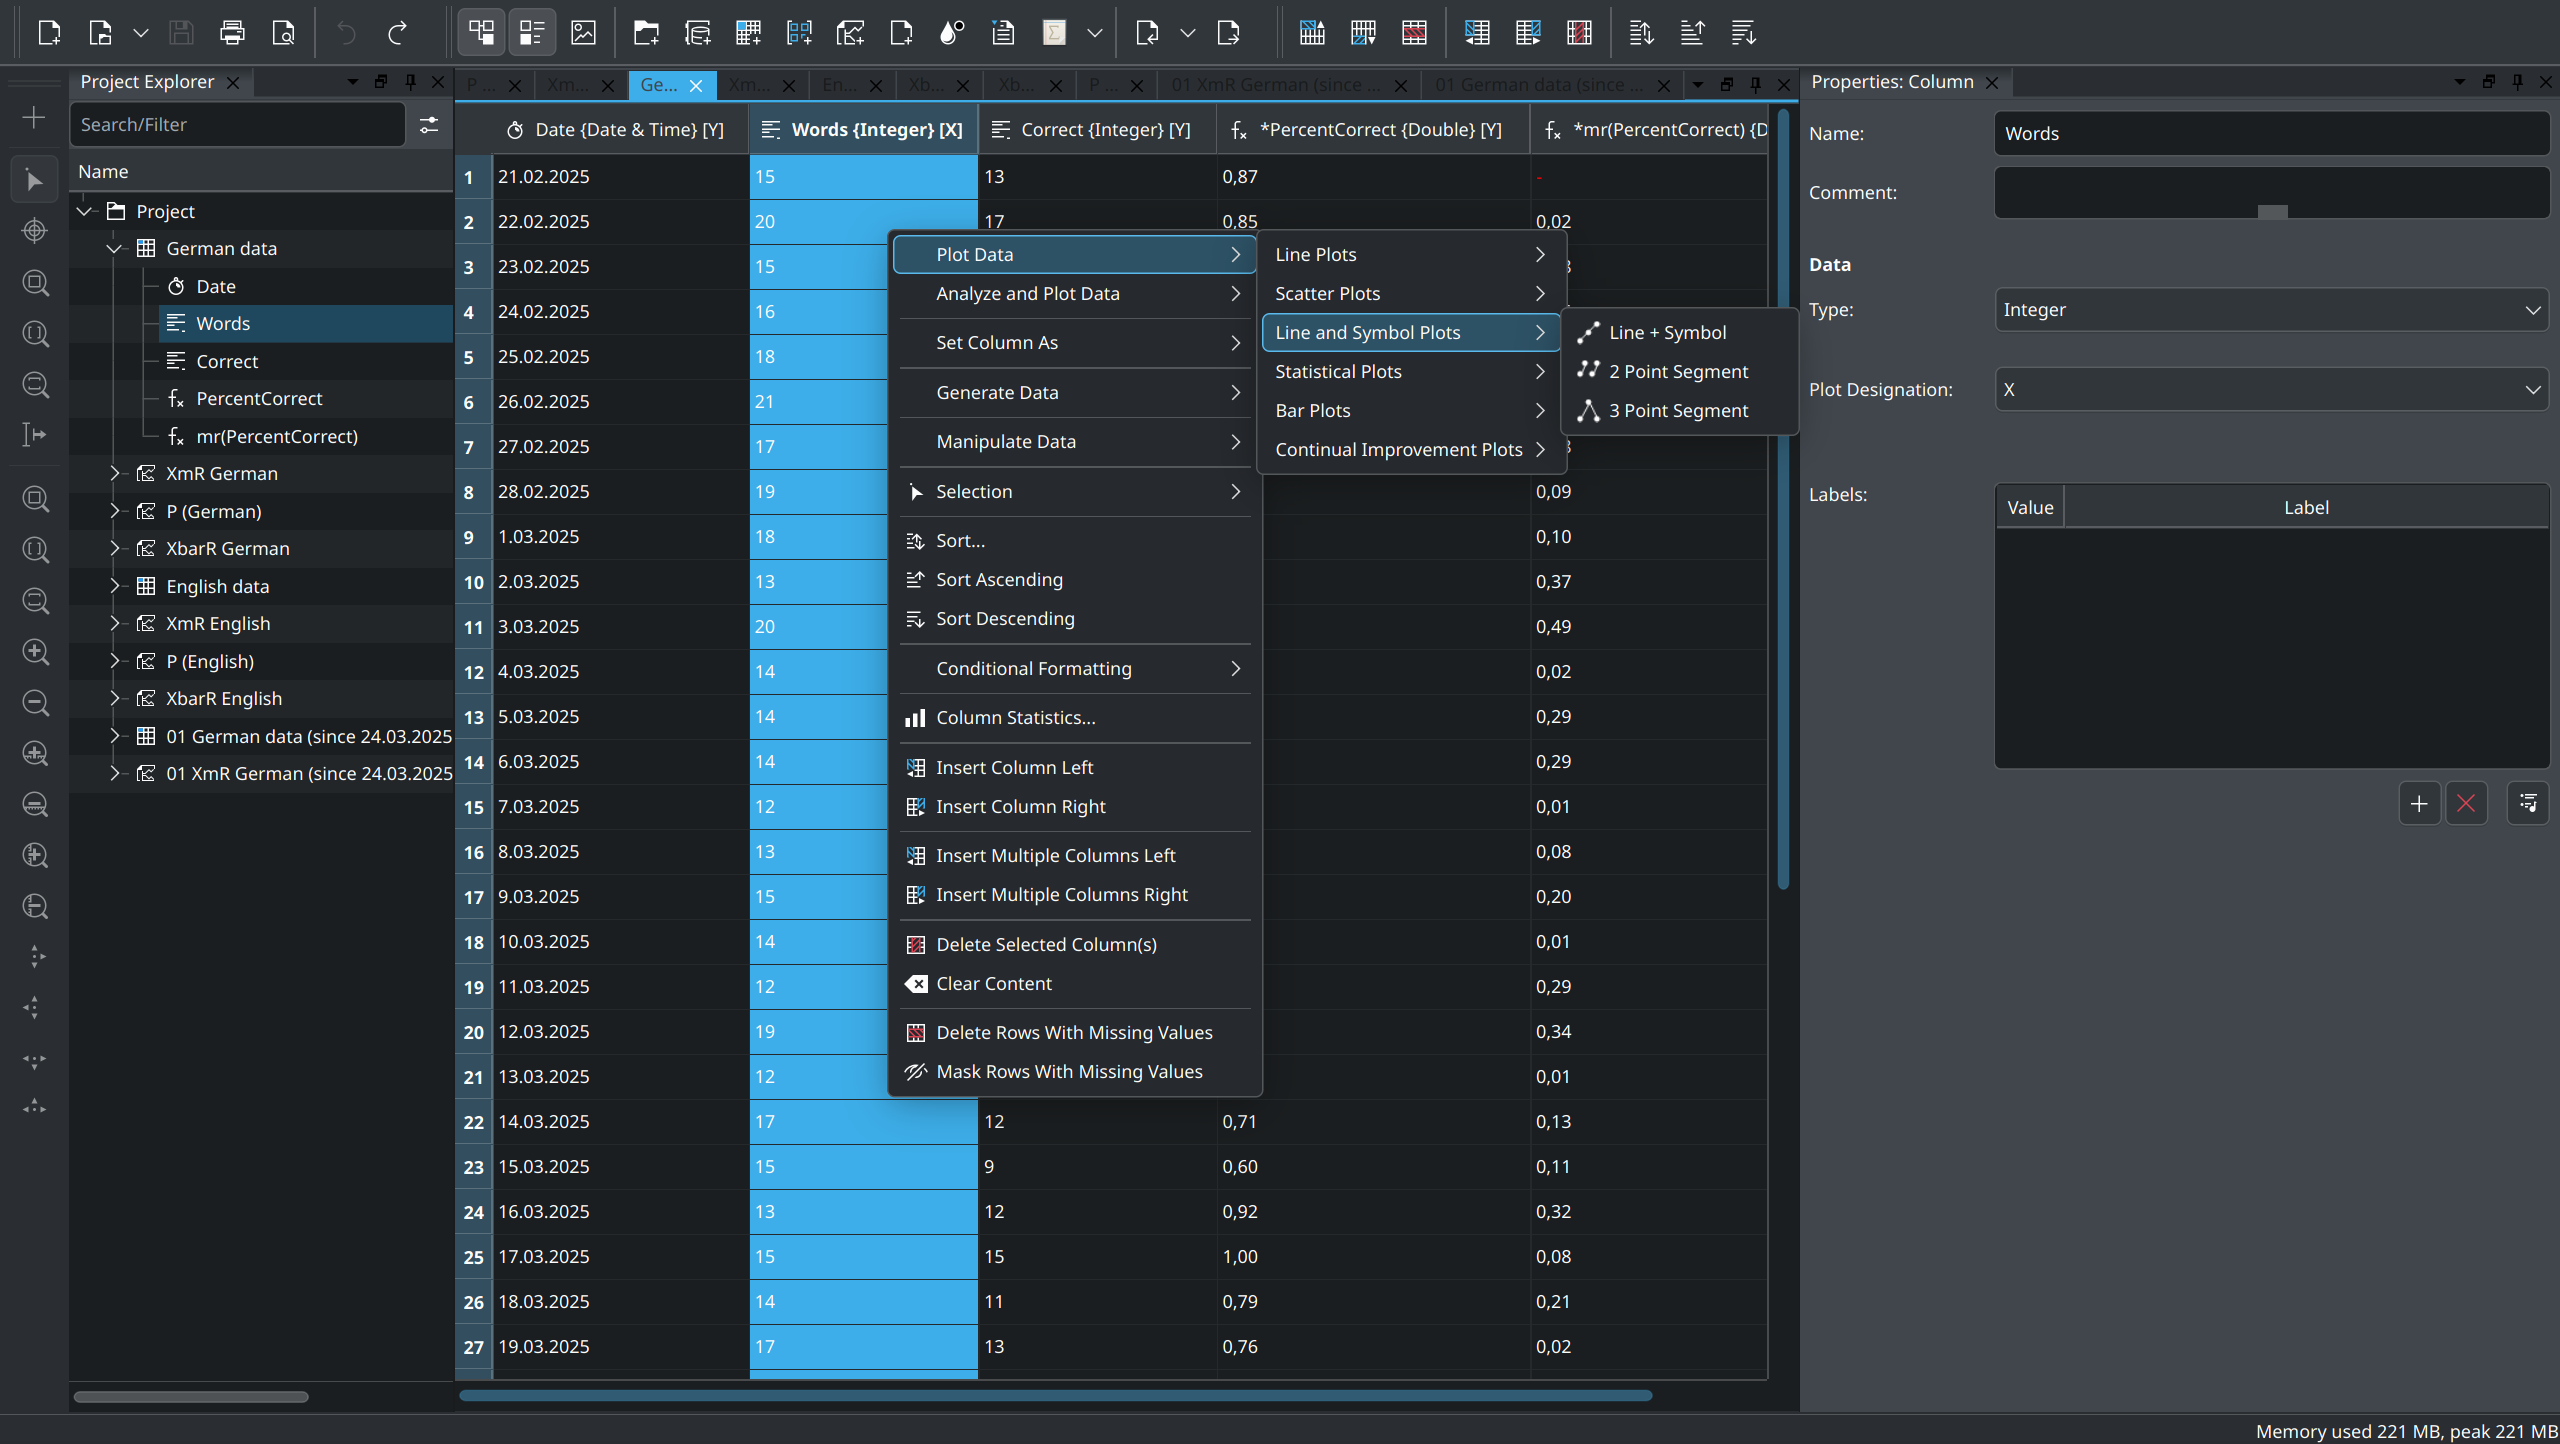
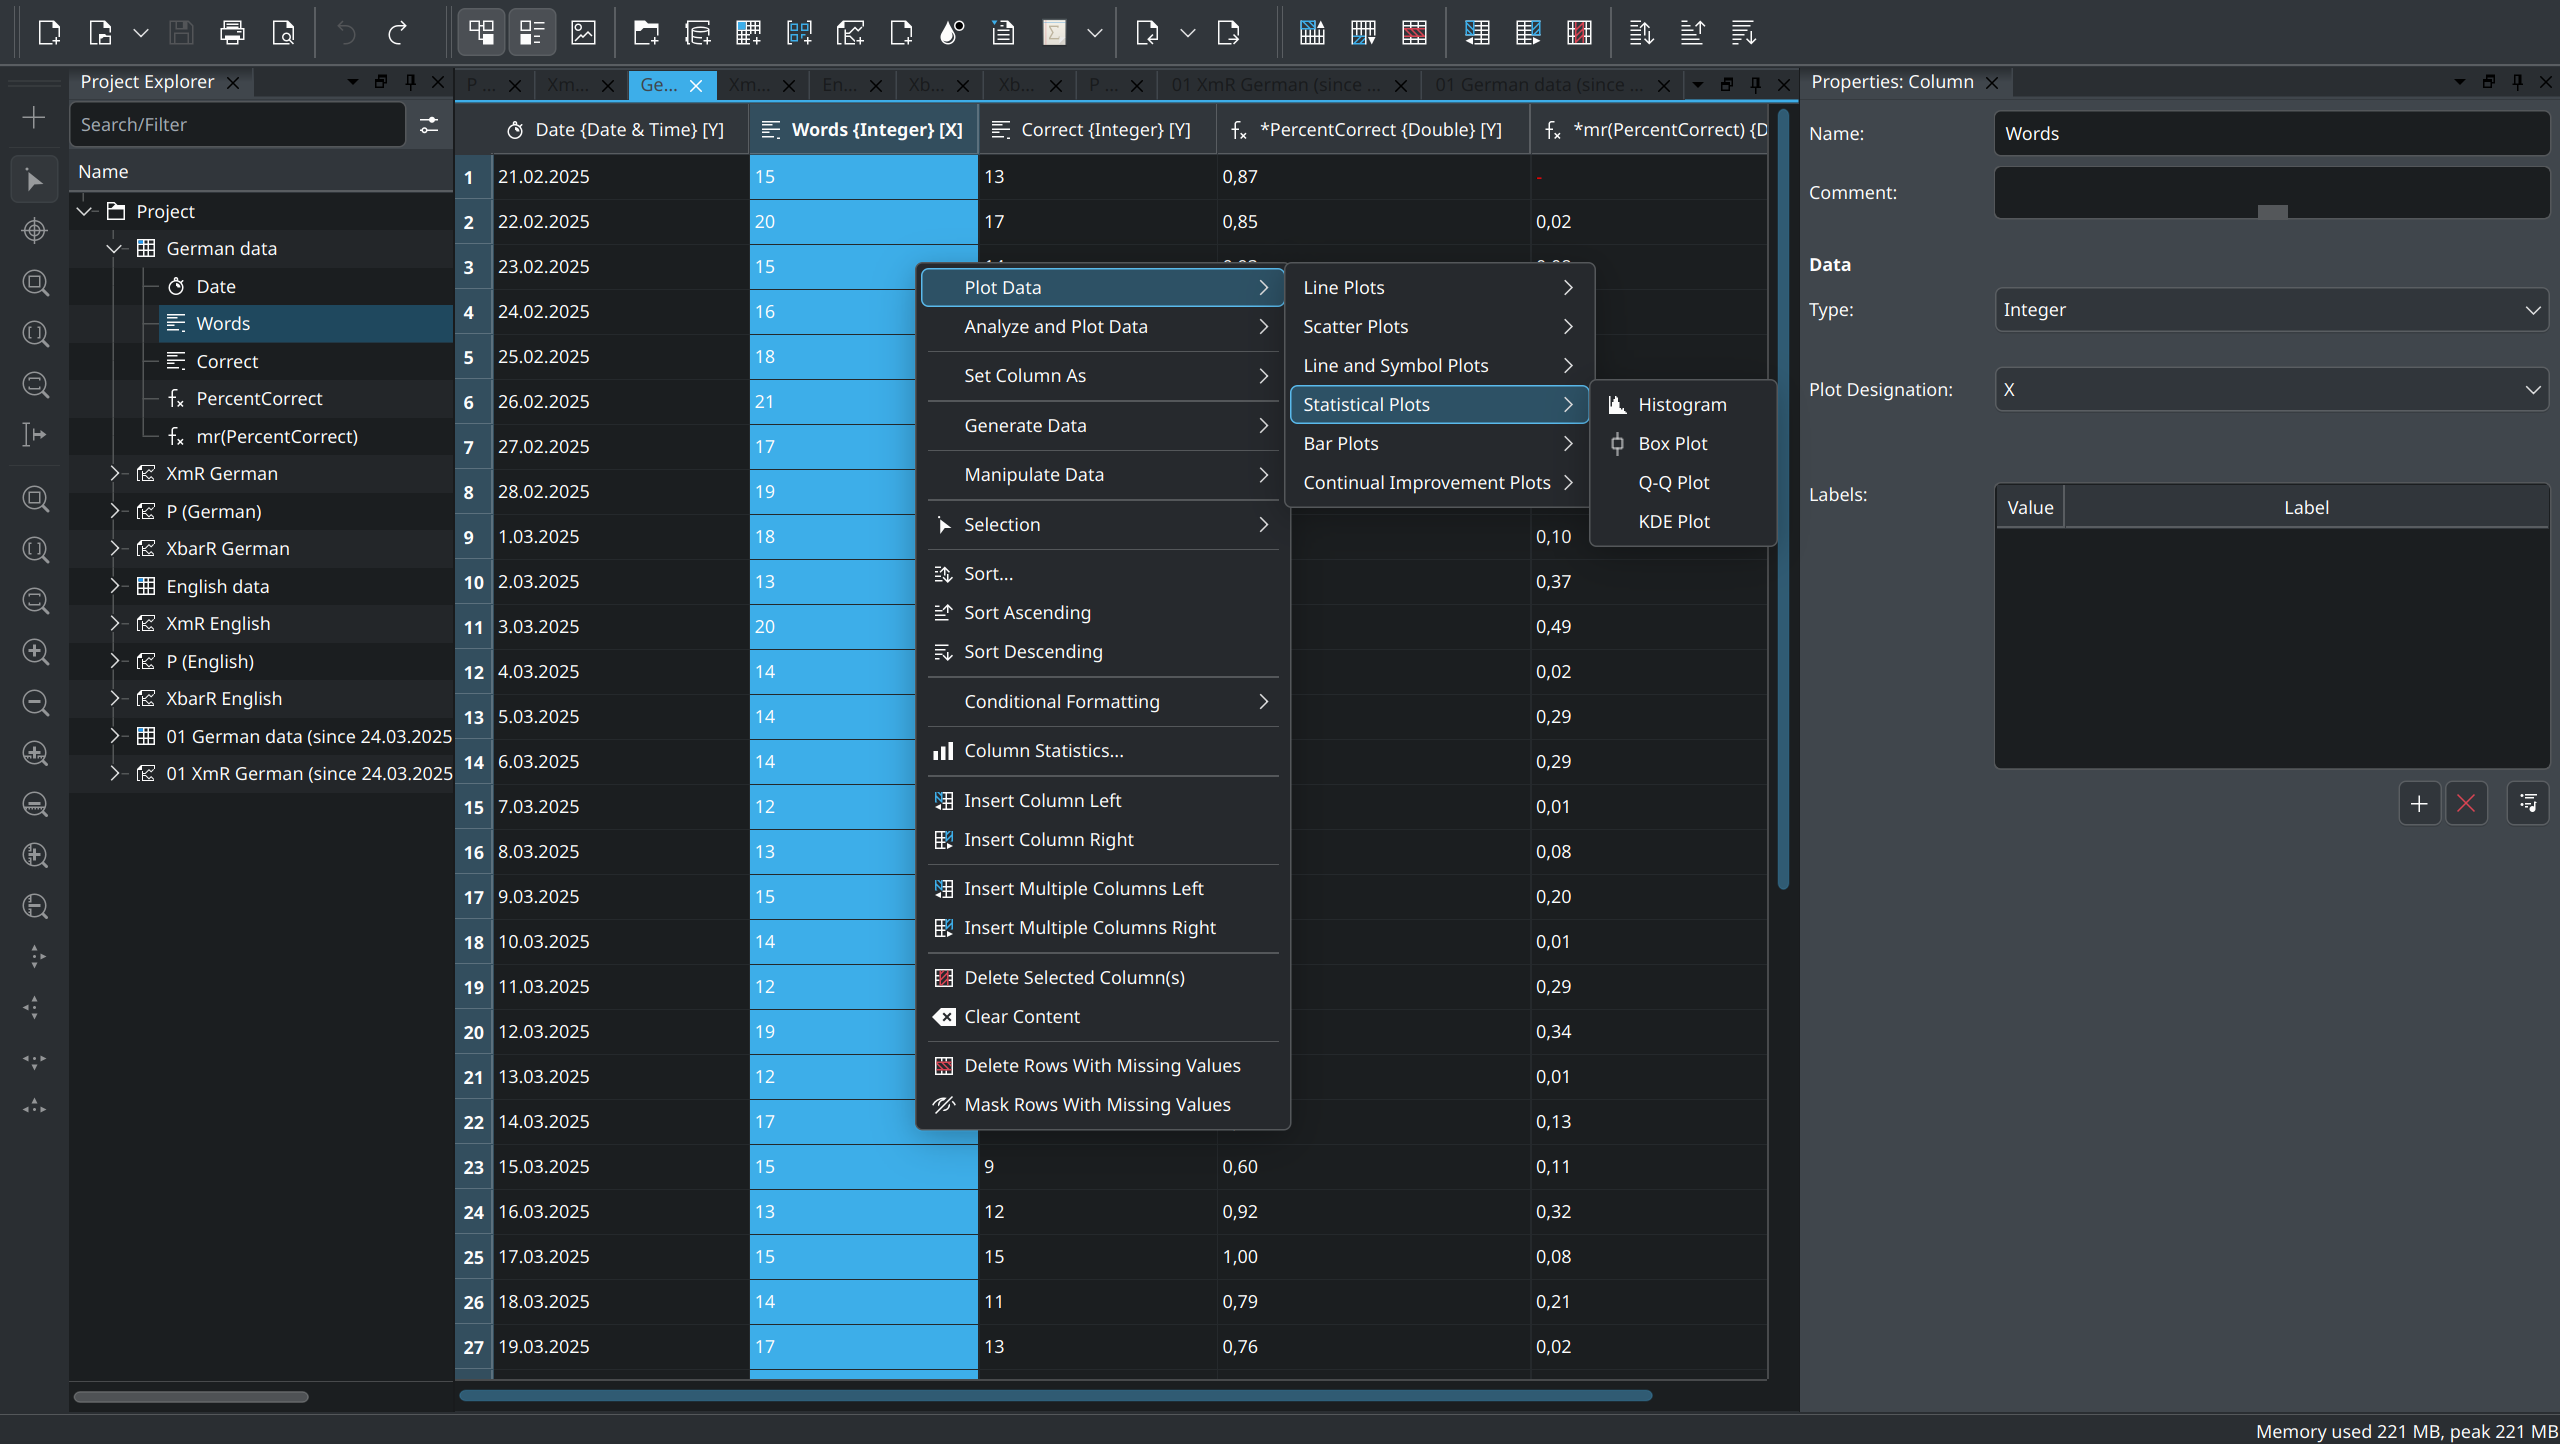
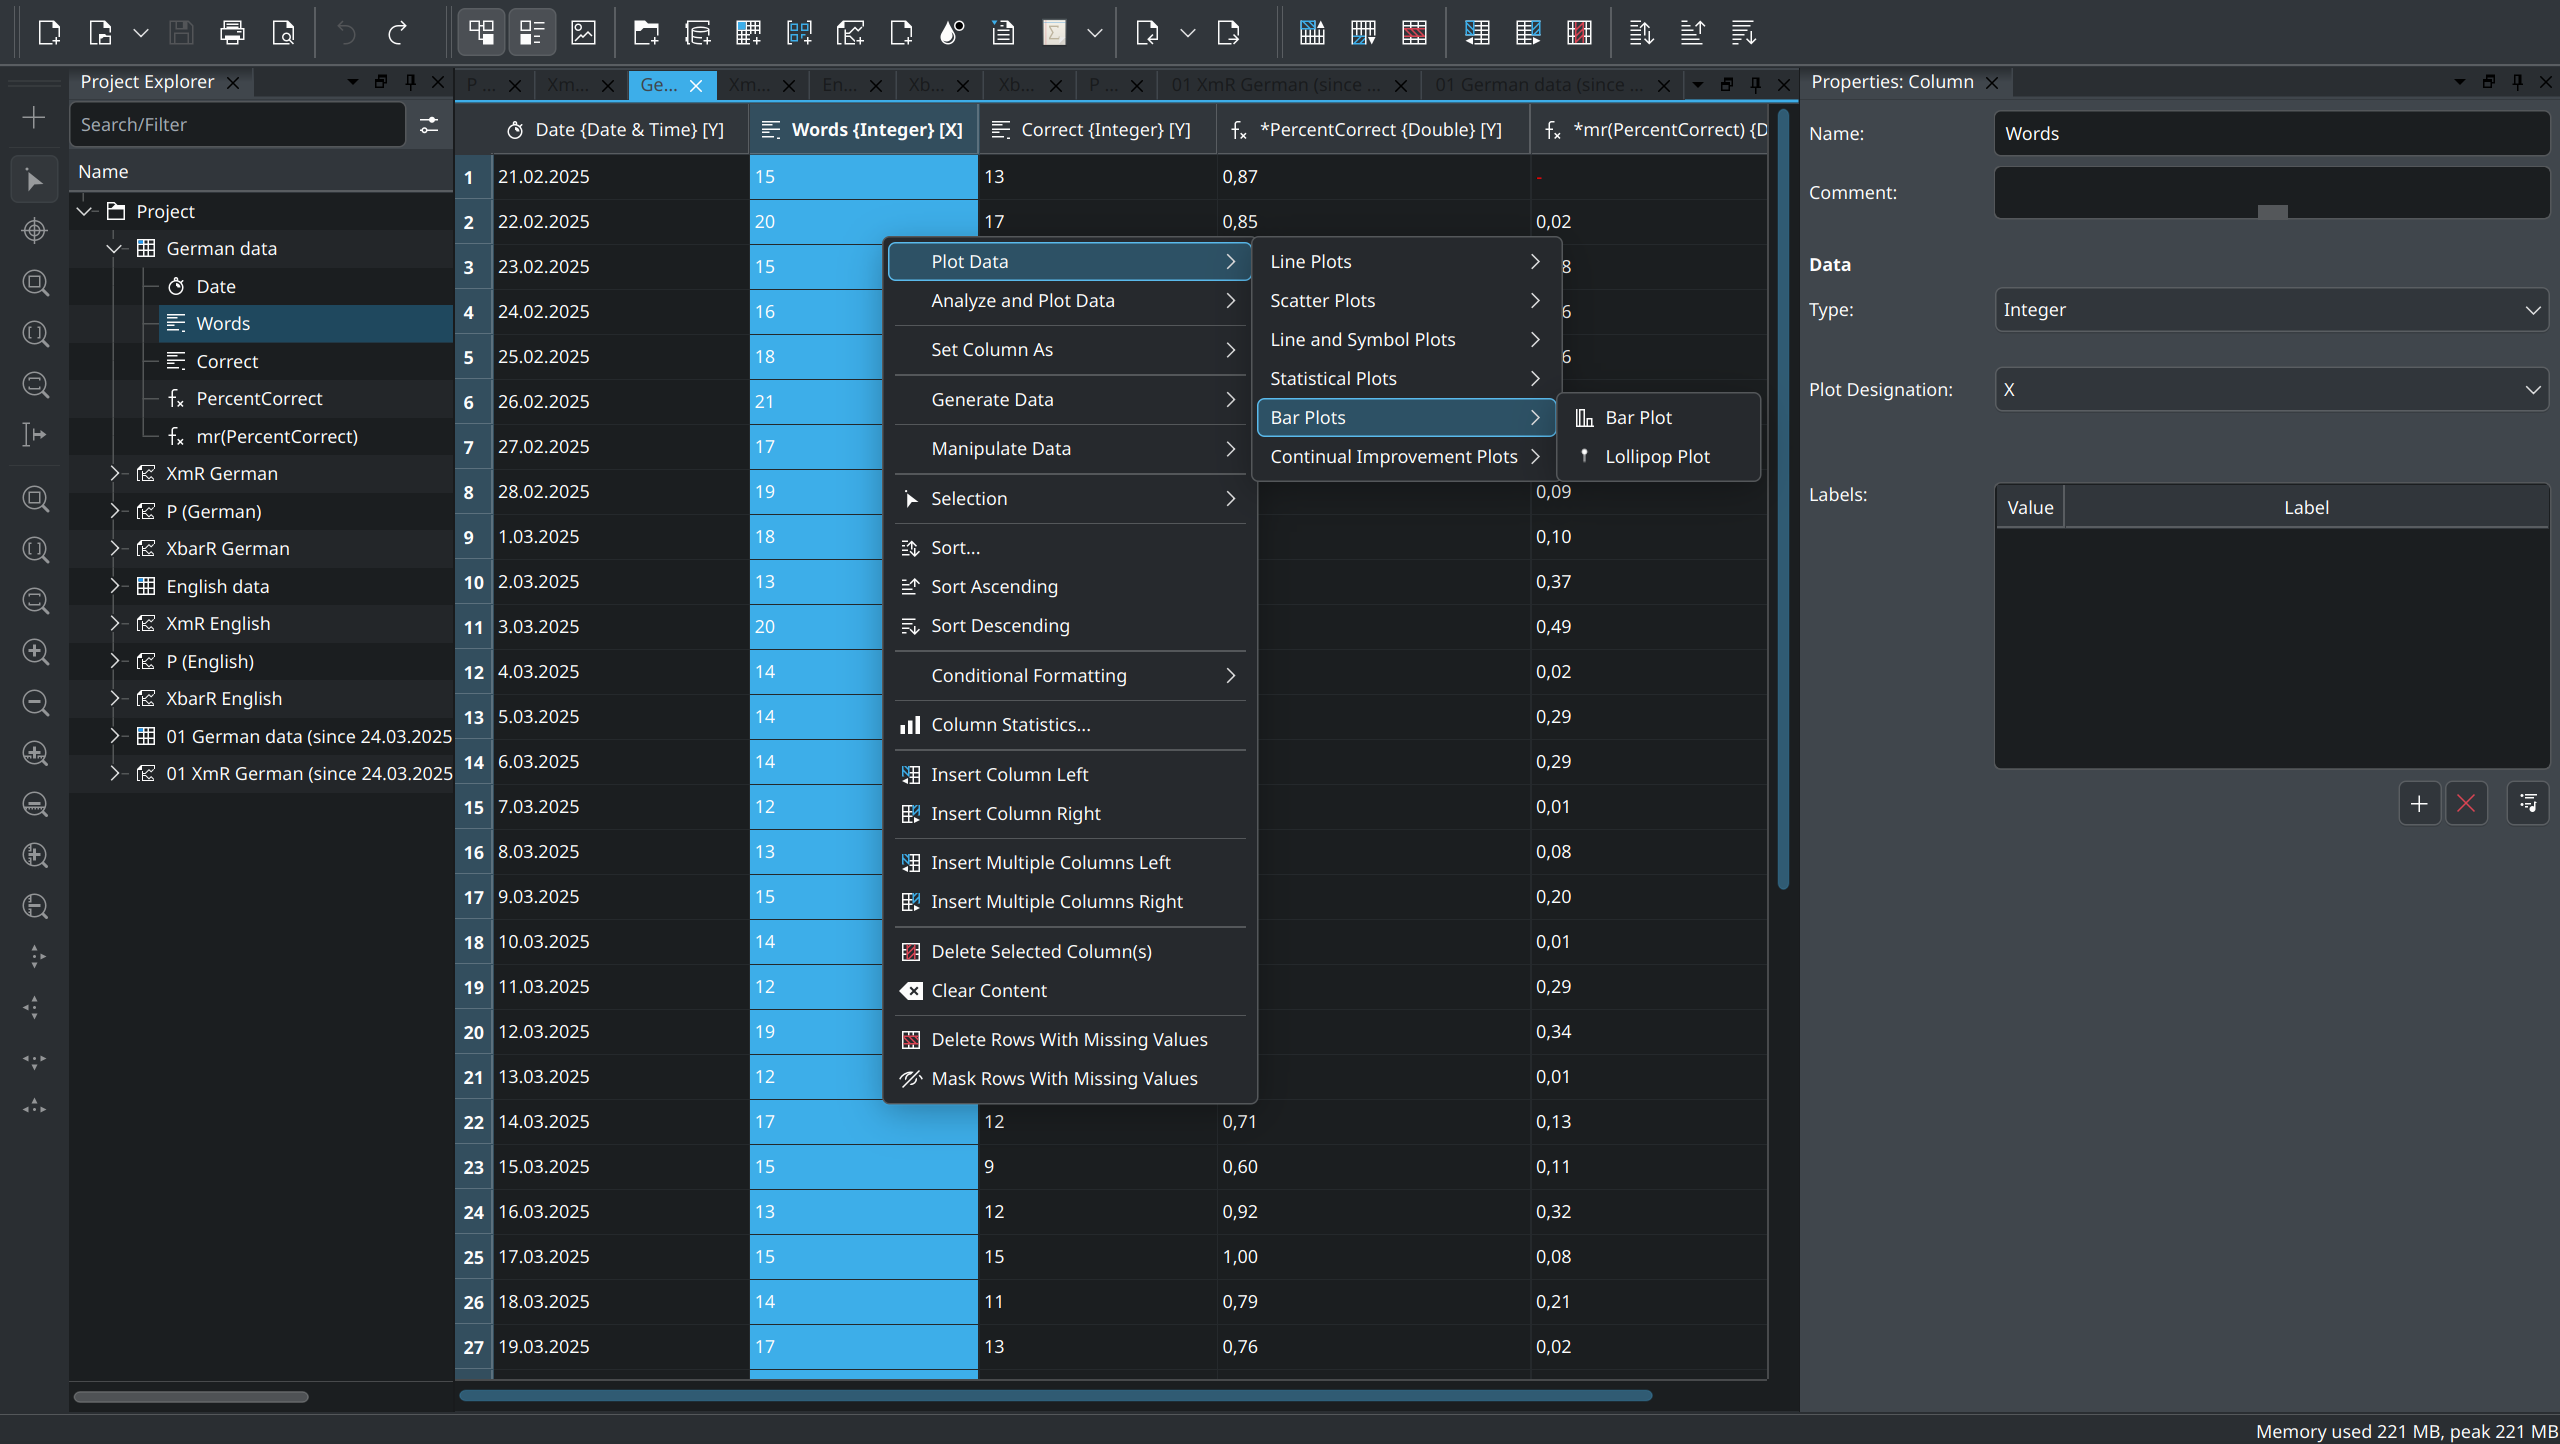
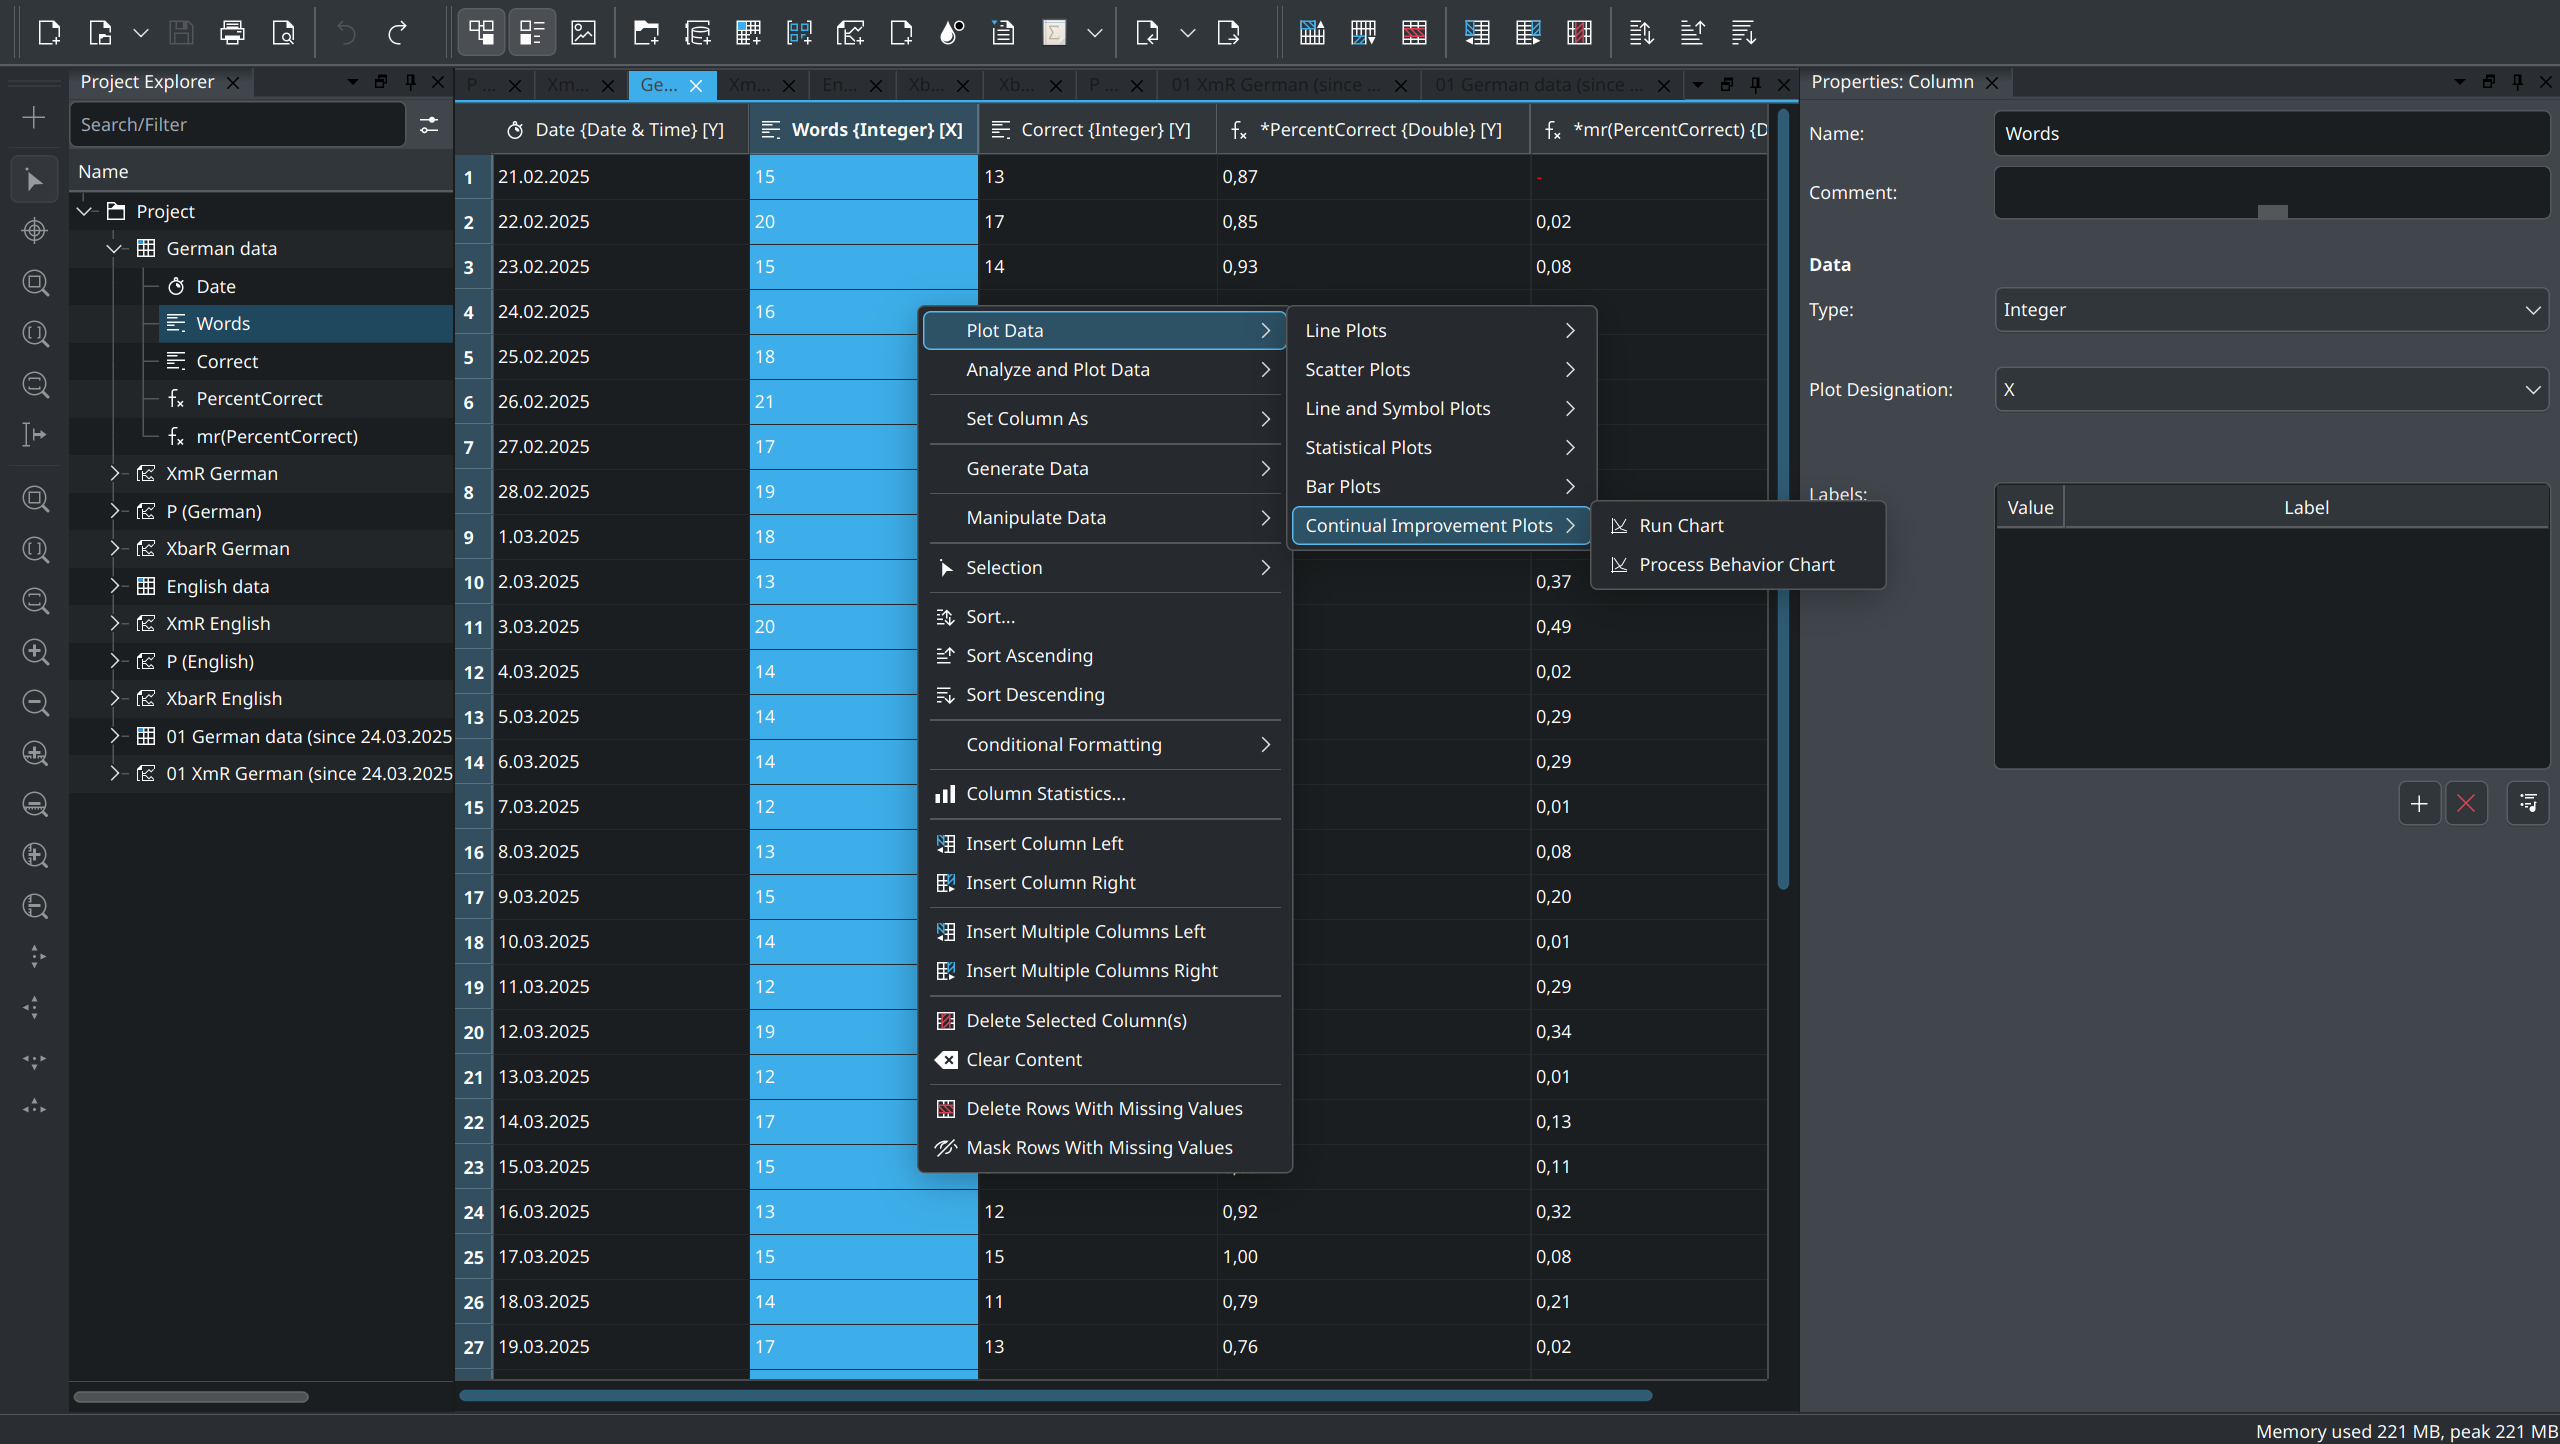
- New plots have been introduced, including Continual Improvement (Quality Improvement) Plots – the Run Chart and the Process Behavior Chart (Control Chart or Shewhart Chart) such as X-Chart, mR-Chart, X-Bar Chart, R-Bar Chart, P-Chart, NP-Chart, C-Chart and U-Chart.
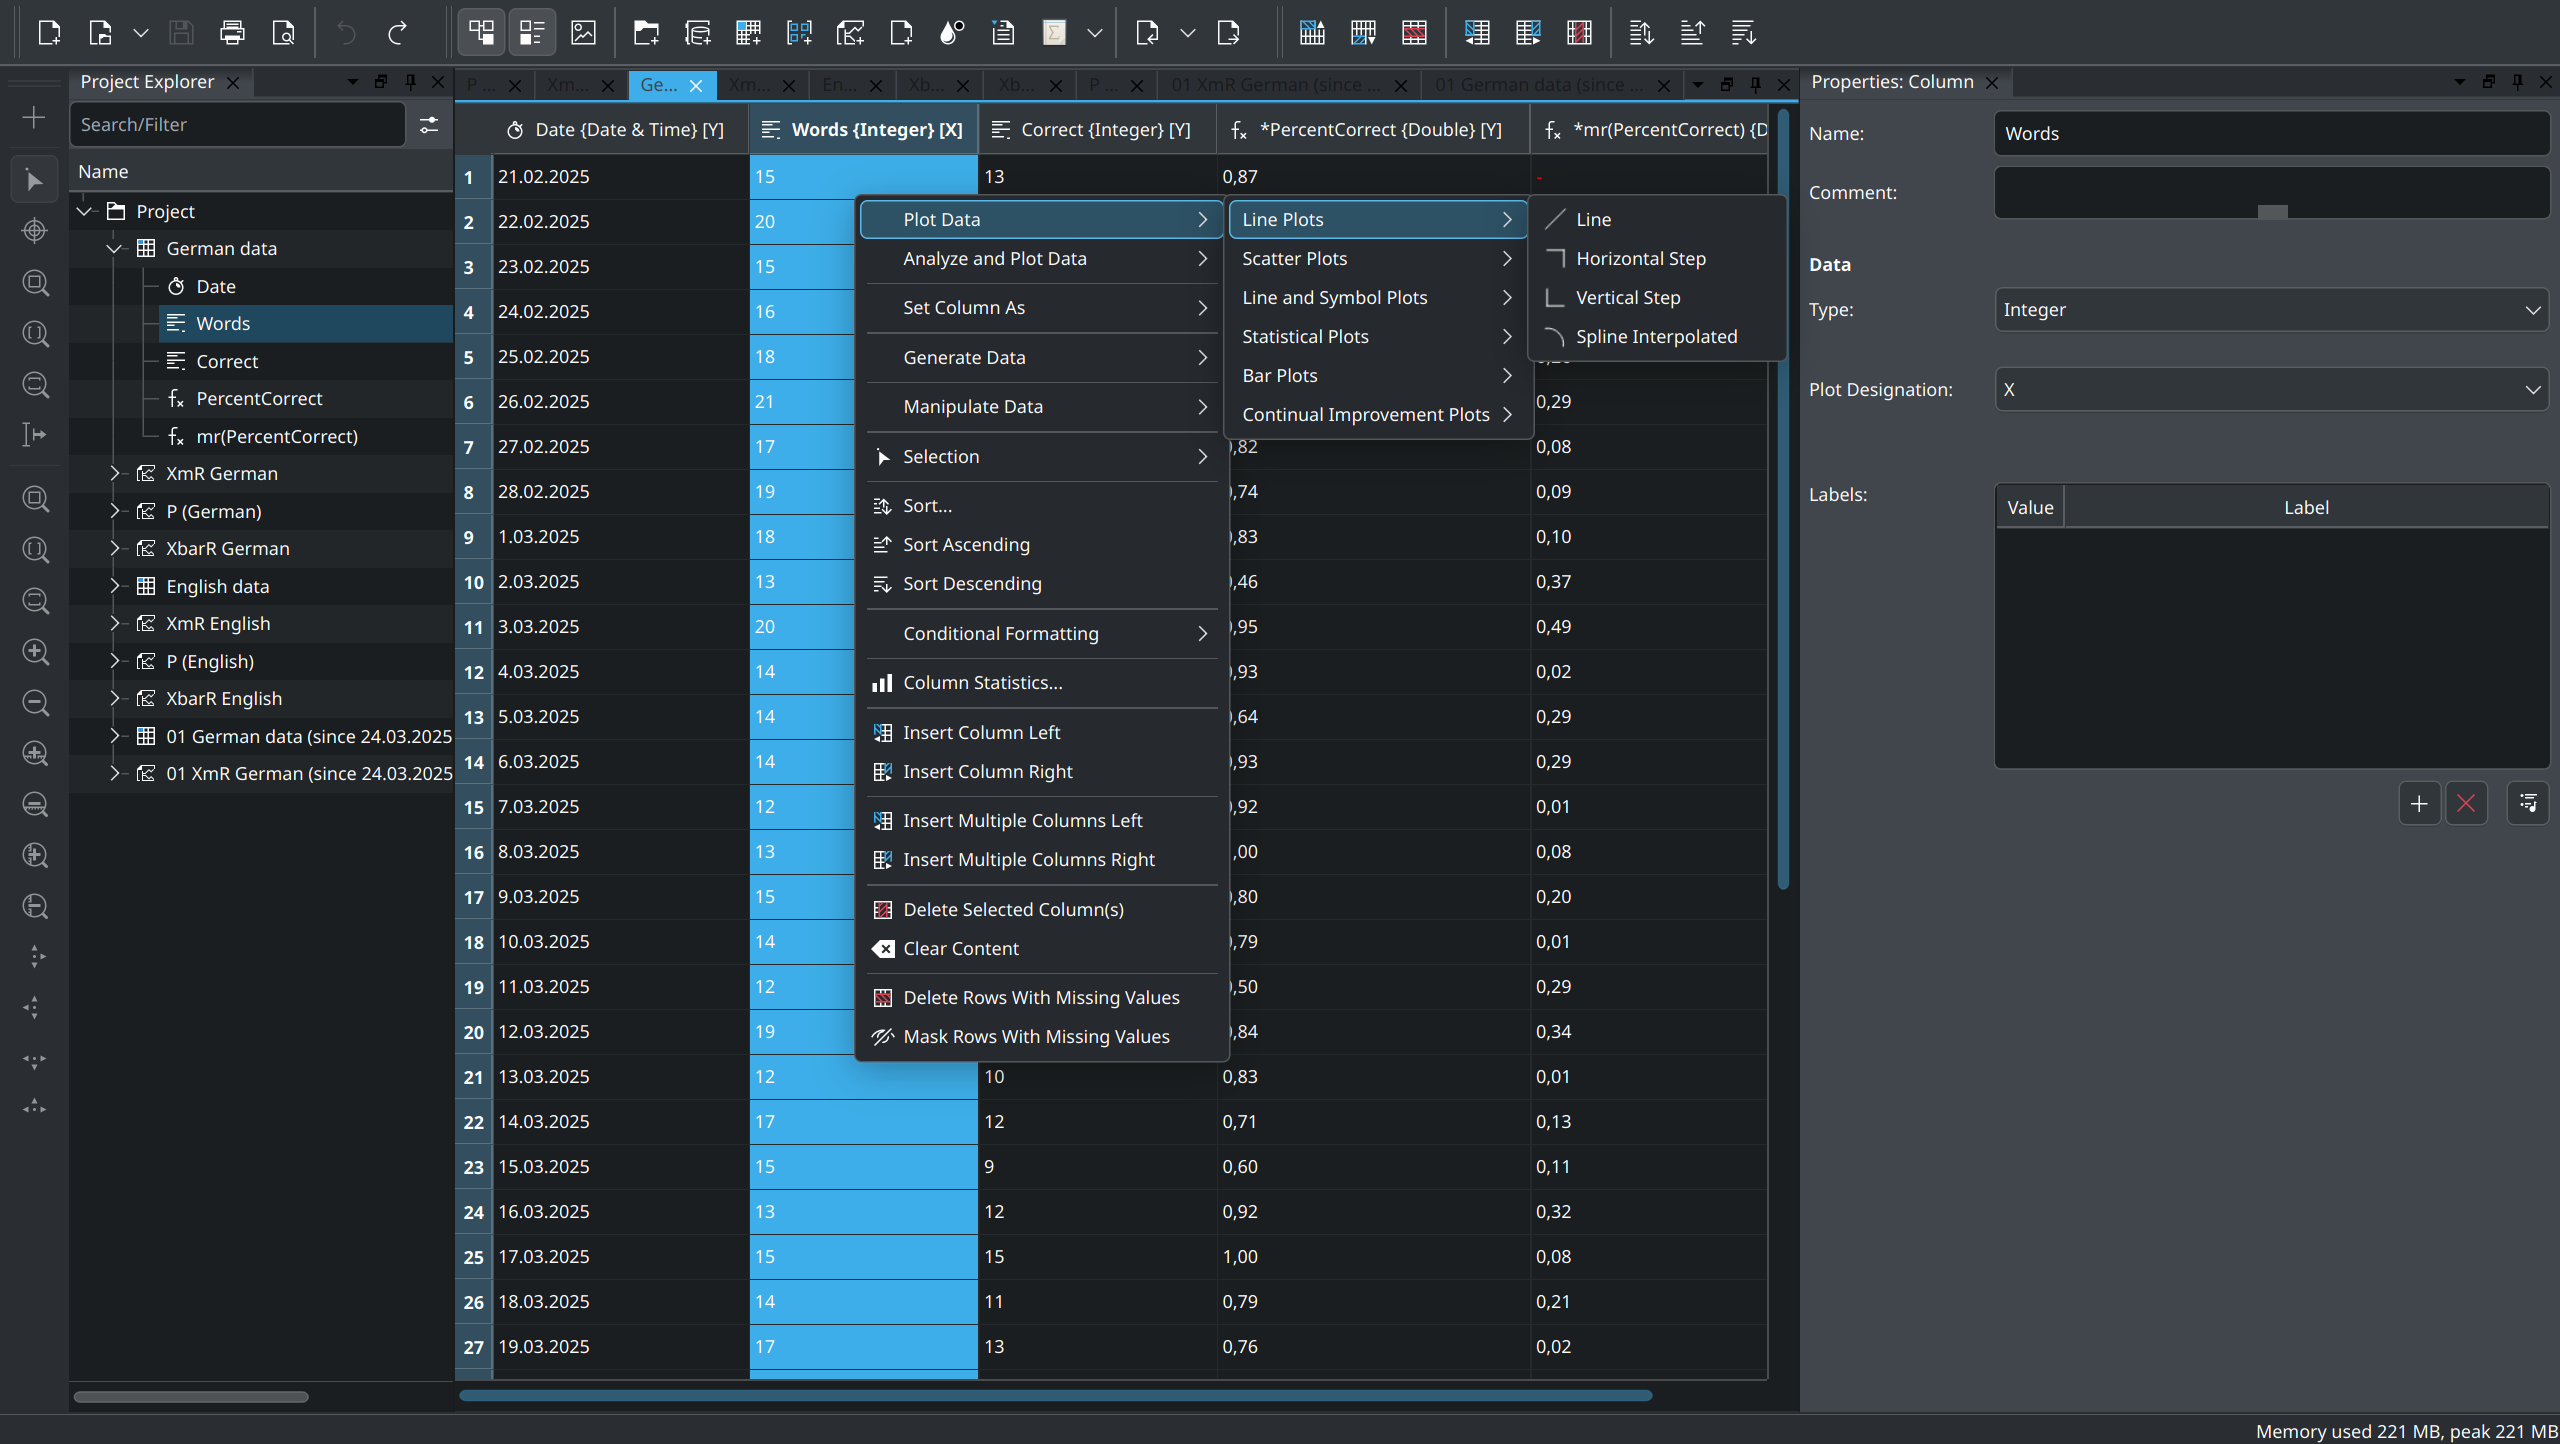
- More plot sub-types are now exposed directly in the context menu, including multiple Line Plots, Scatter Plots, Line and Symbol Plots, Statistical Plots, Bar Plots, and Continual Improvement Plots.
- You can now use the inverse axis scale for Arrhenius plots.
- The plots have been optimized to better use the available space.
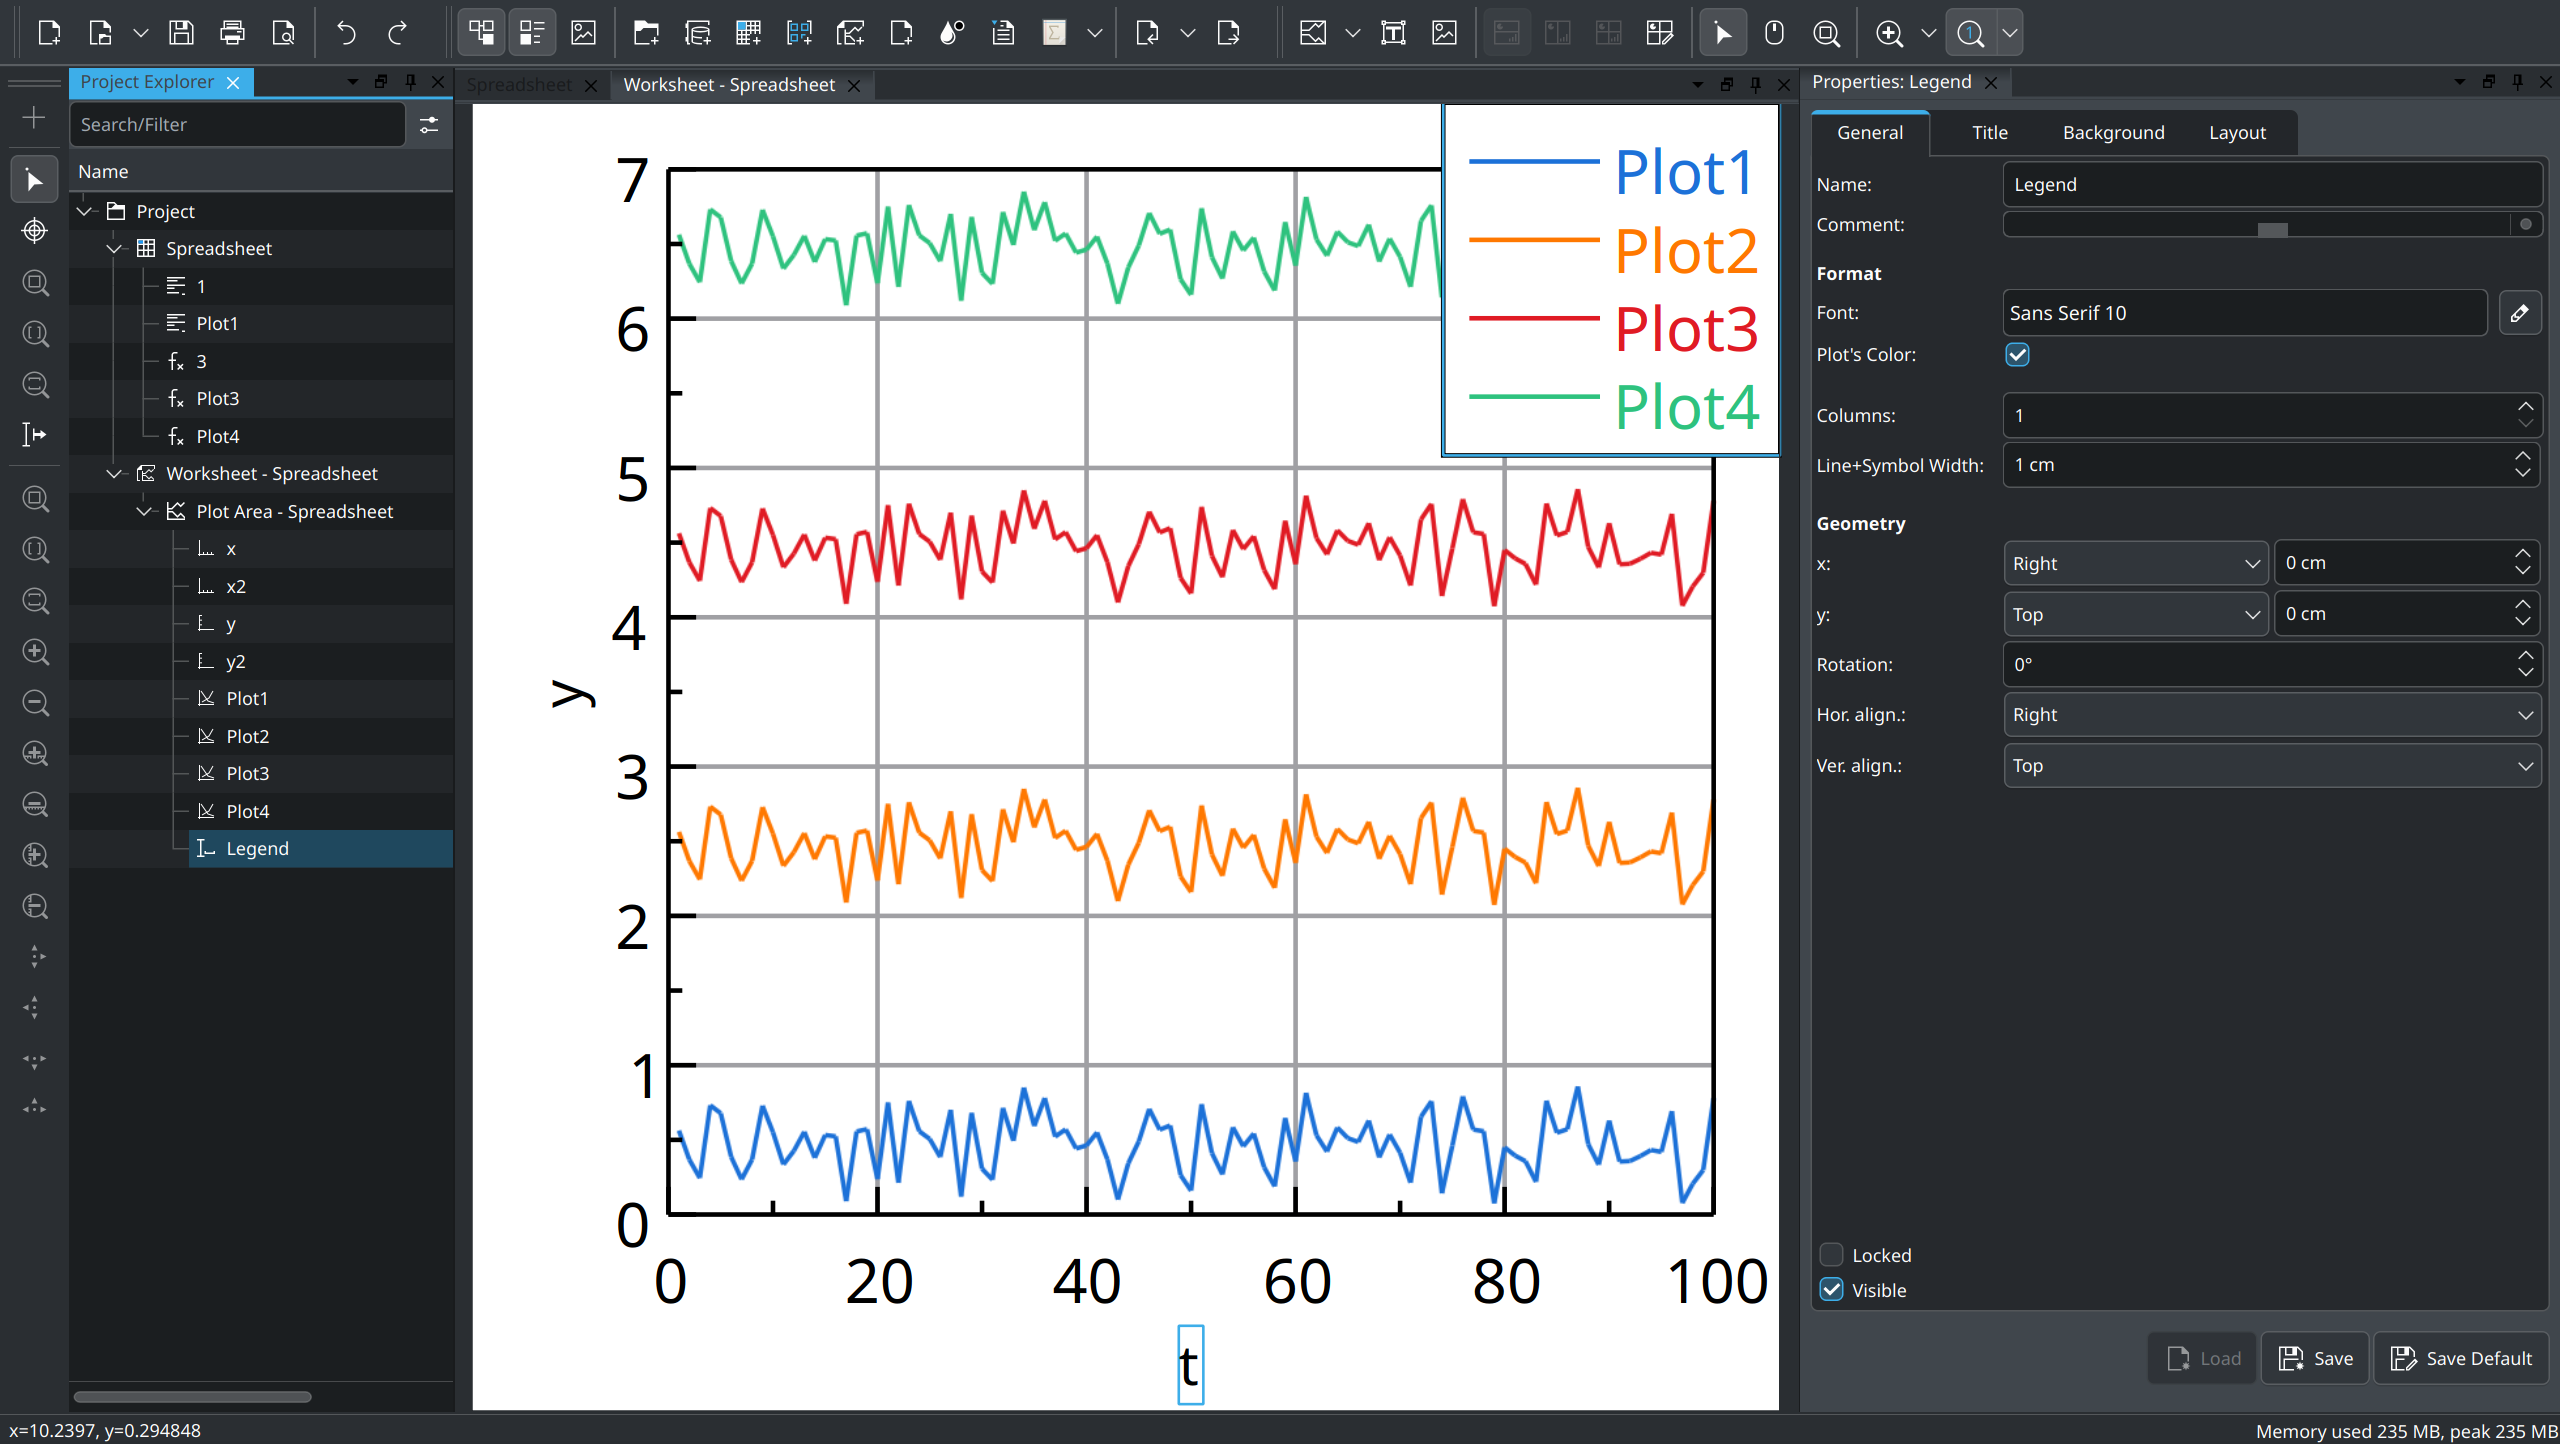
- You can now provide names for plot ranges, making it easier to look up and assign elements within the plot.
- A new option allows using plots’ main color for the text color of the names shown in the legend.
Spreadsheet
Spreadsheets get more functions and operations to modify, generate and understand your data, including:
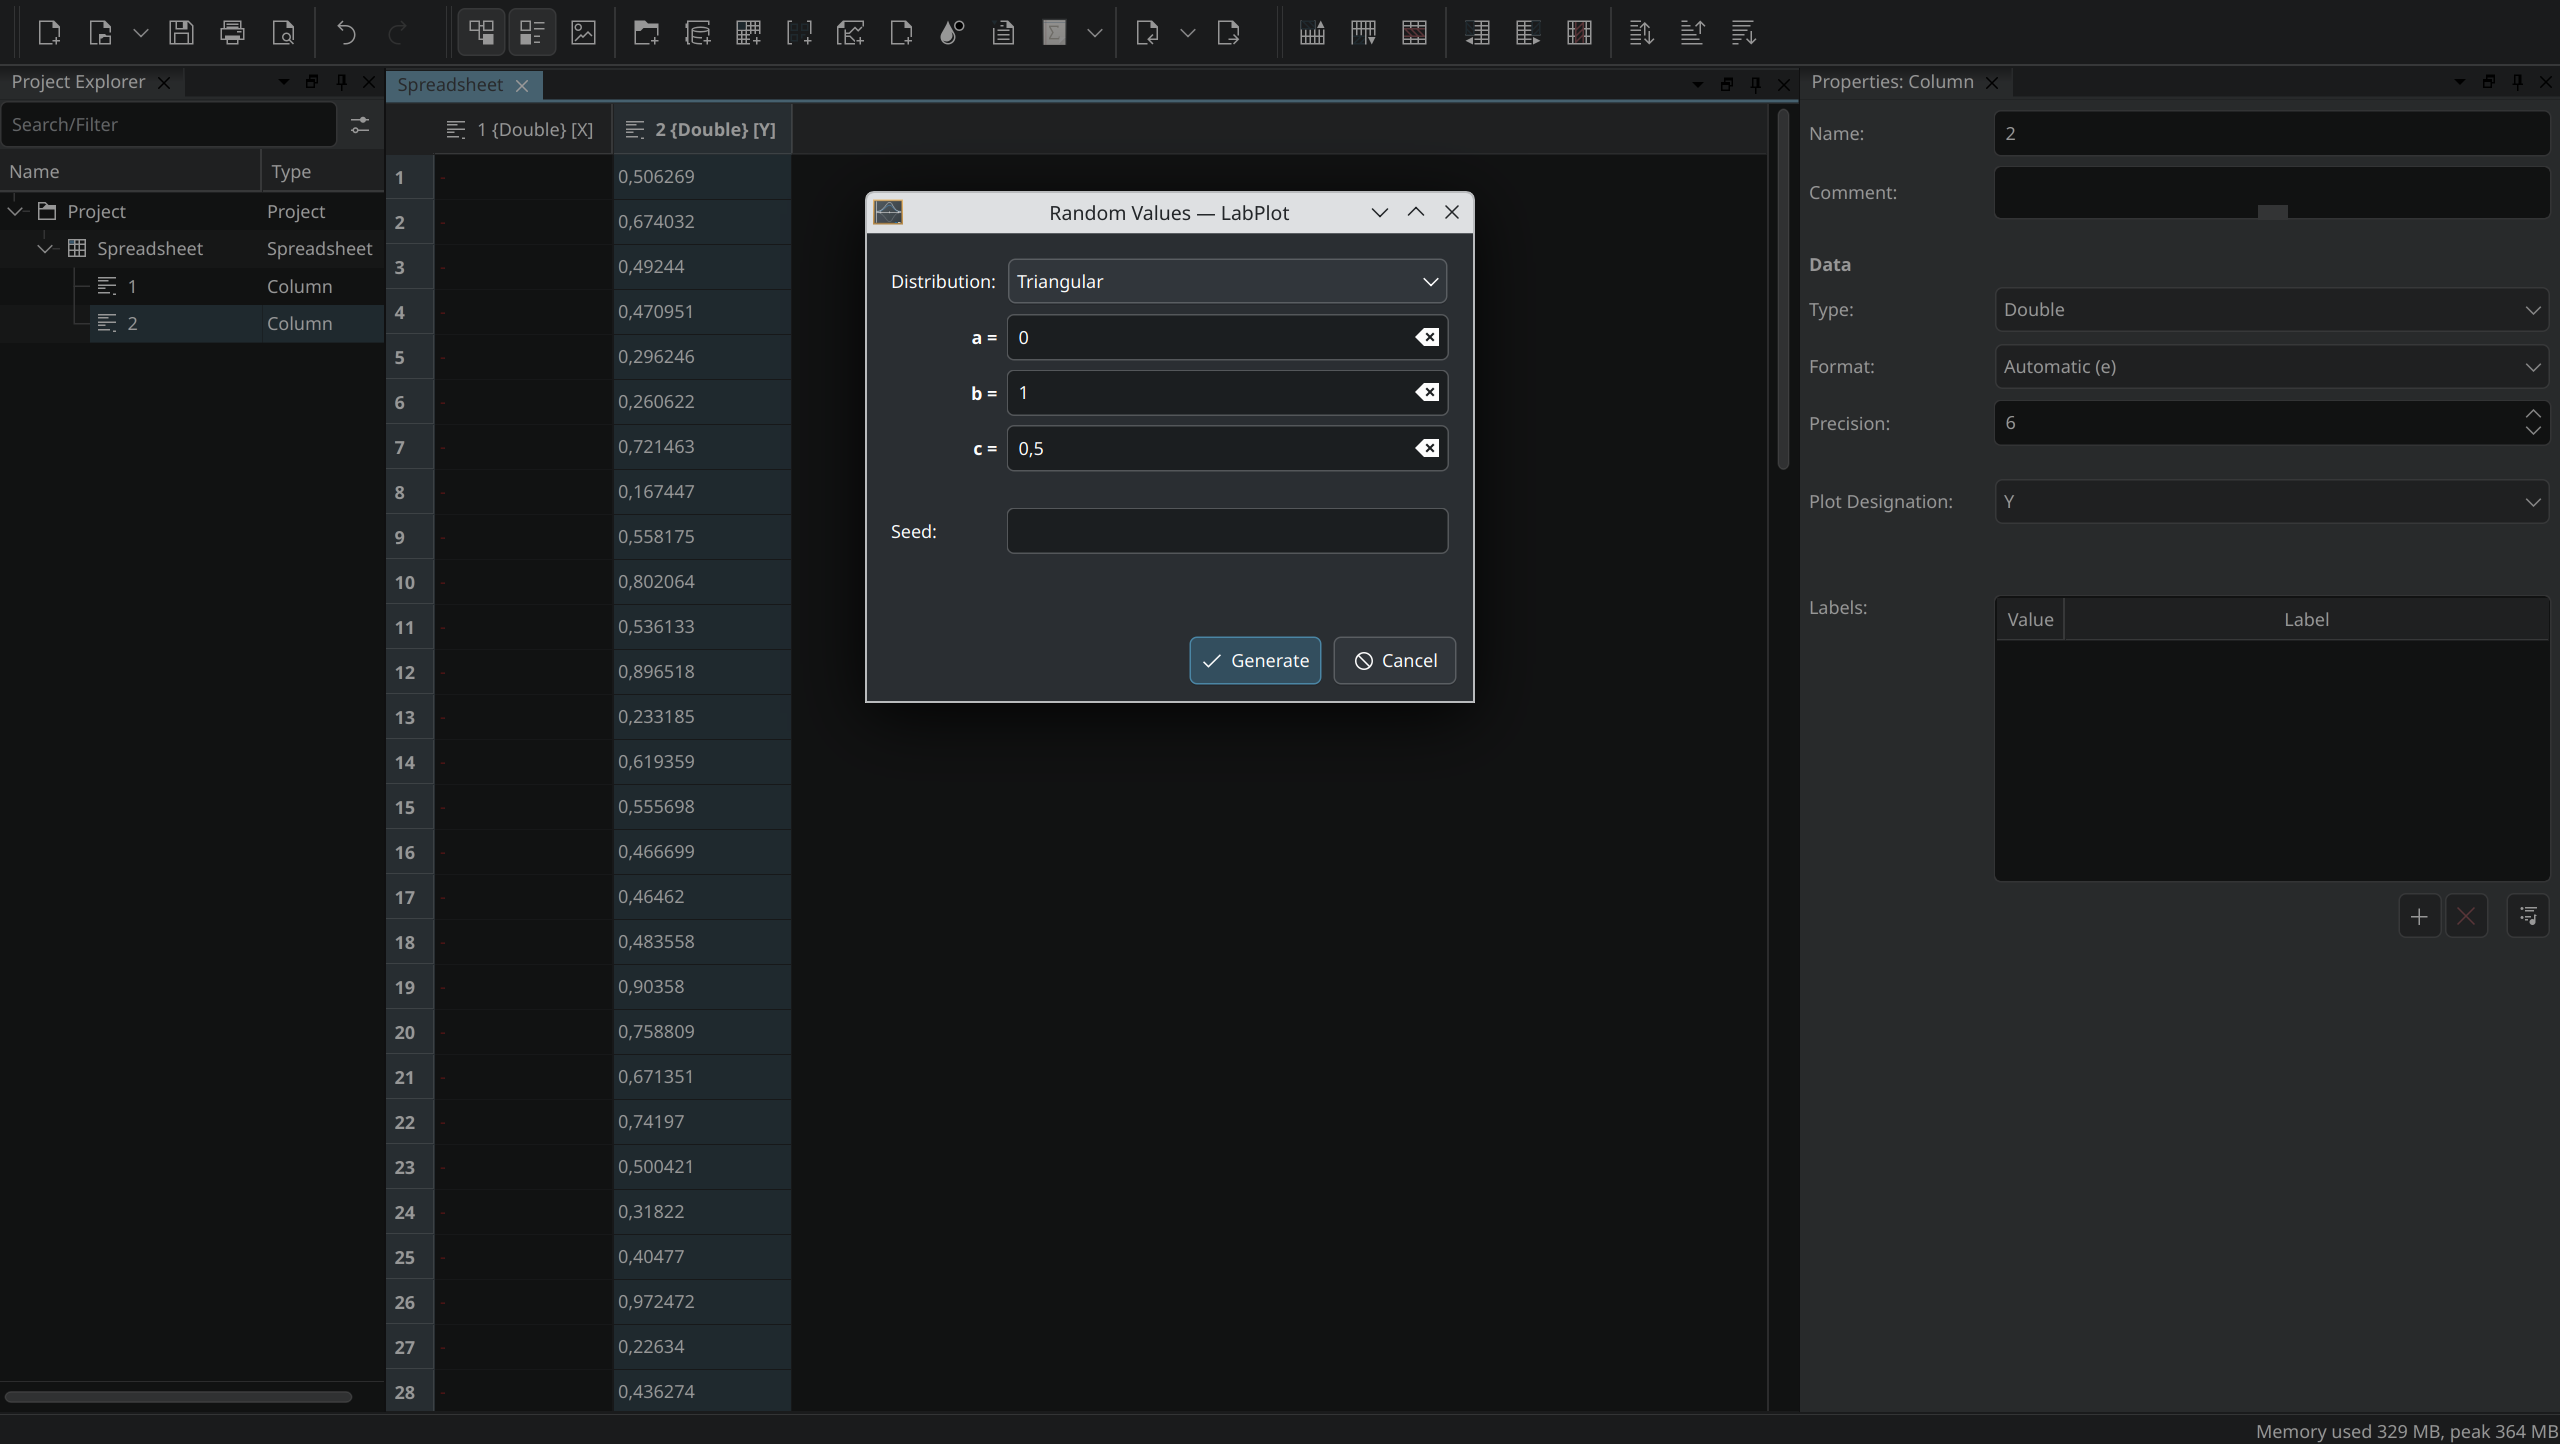
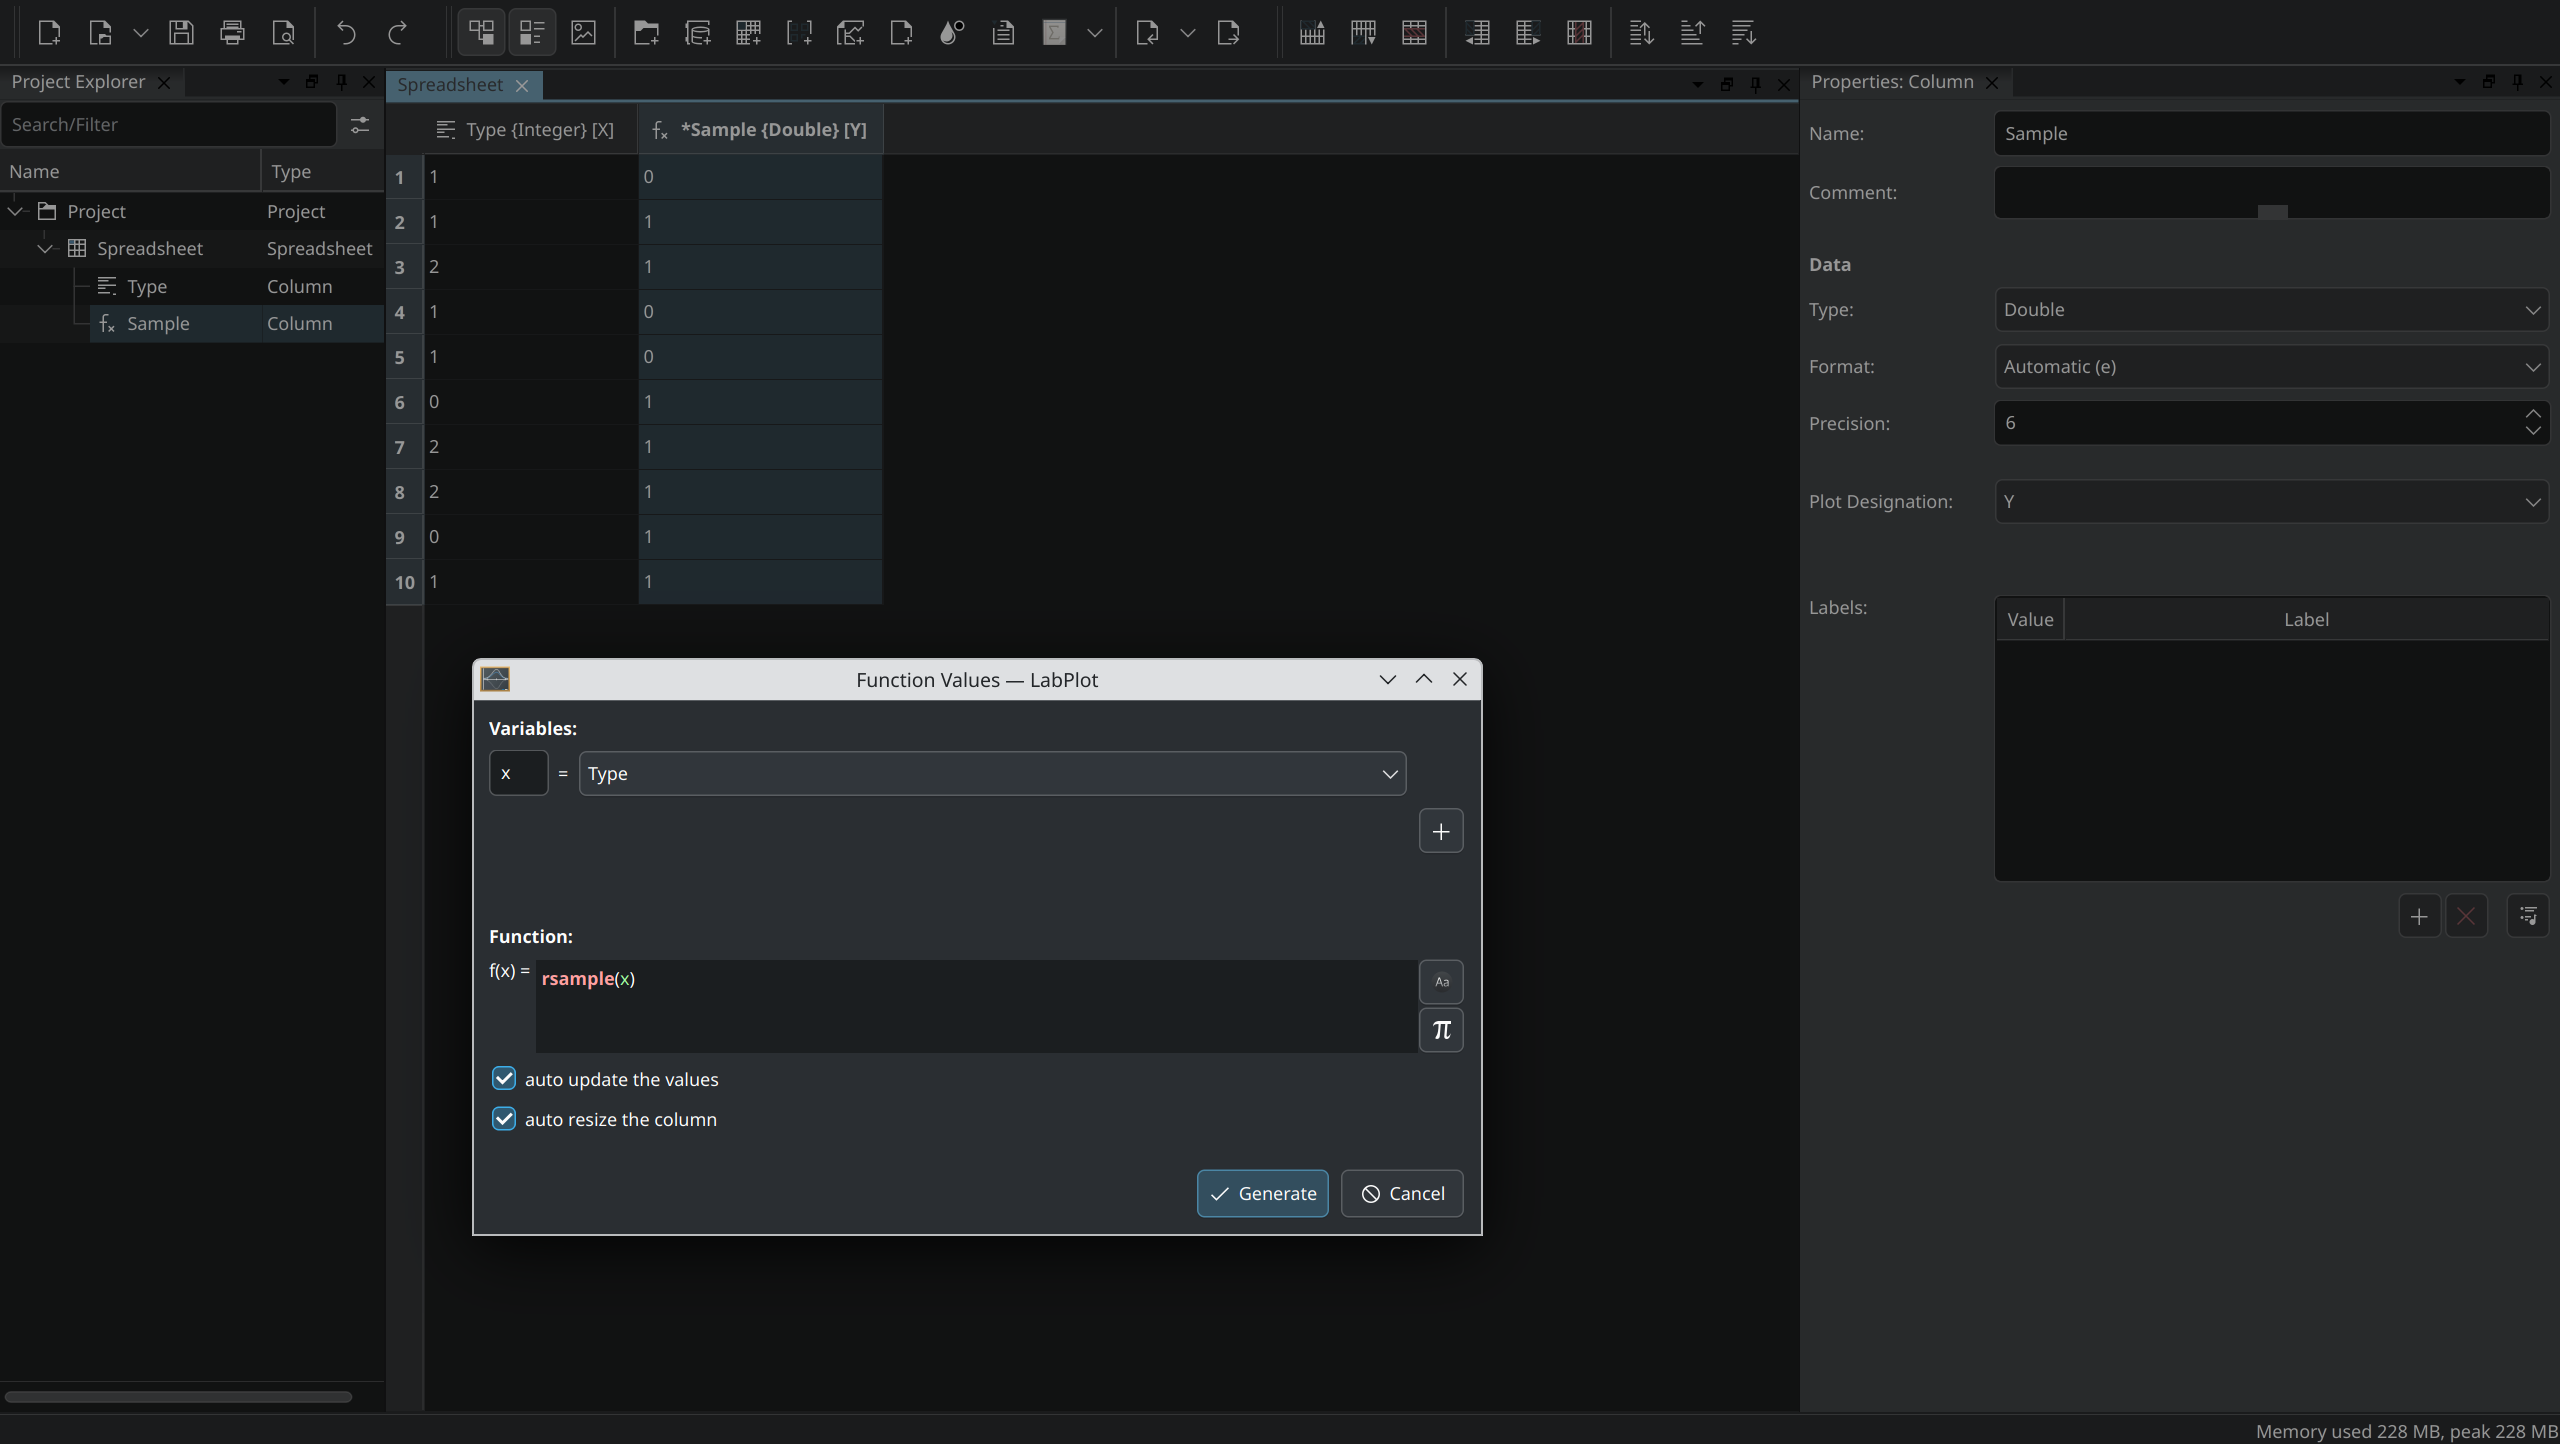
- Periodic and random sampling functions, such as psample(n;x) and rsample(x).
- The properties used to generate random values in a column are saved for easier re-use, ensuring consistency and reproducibility in your data.
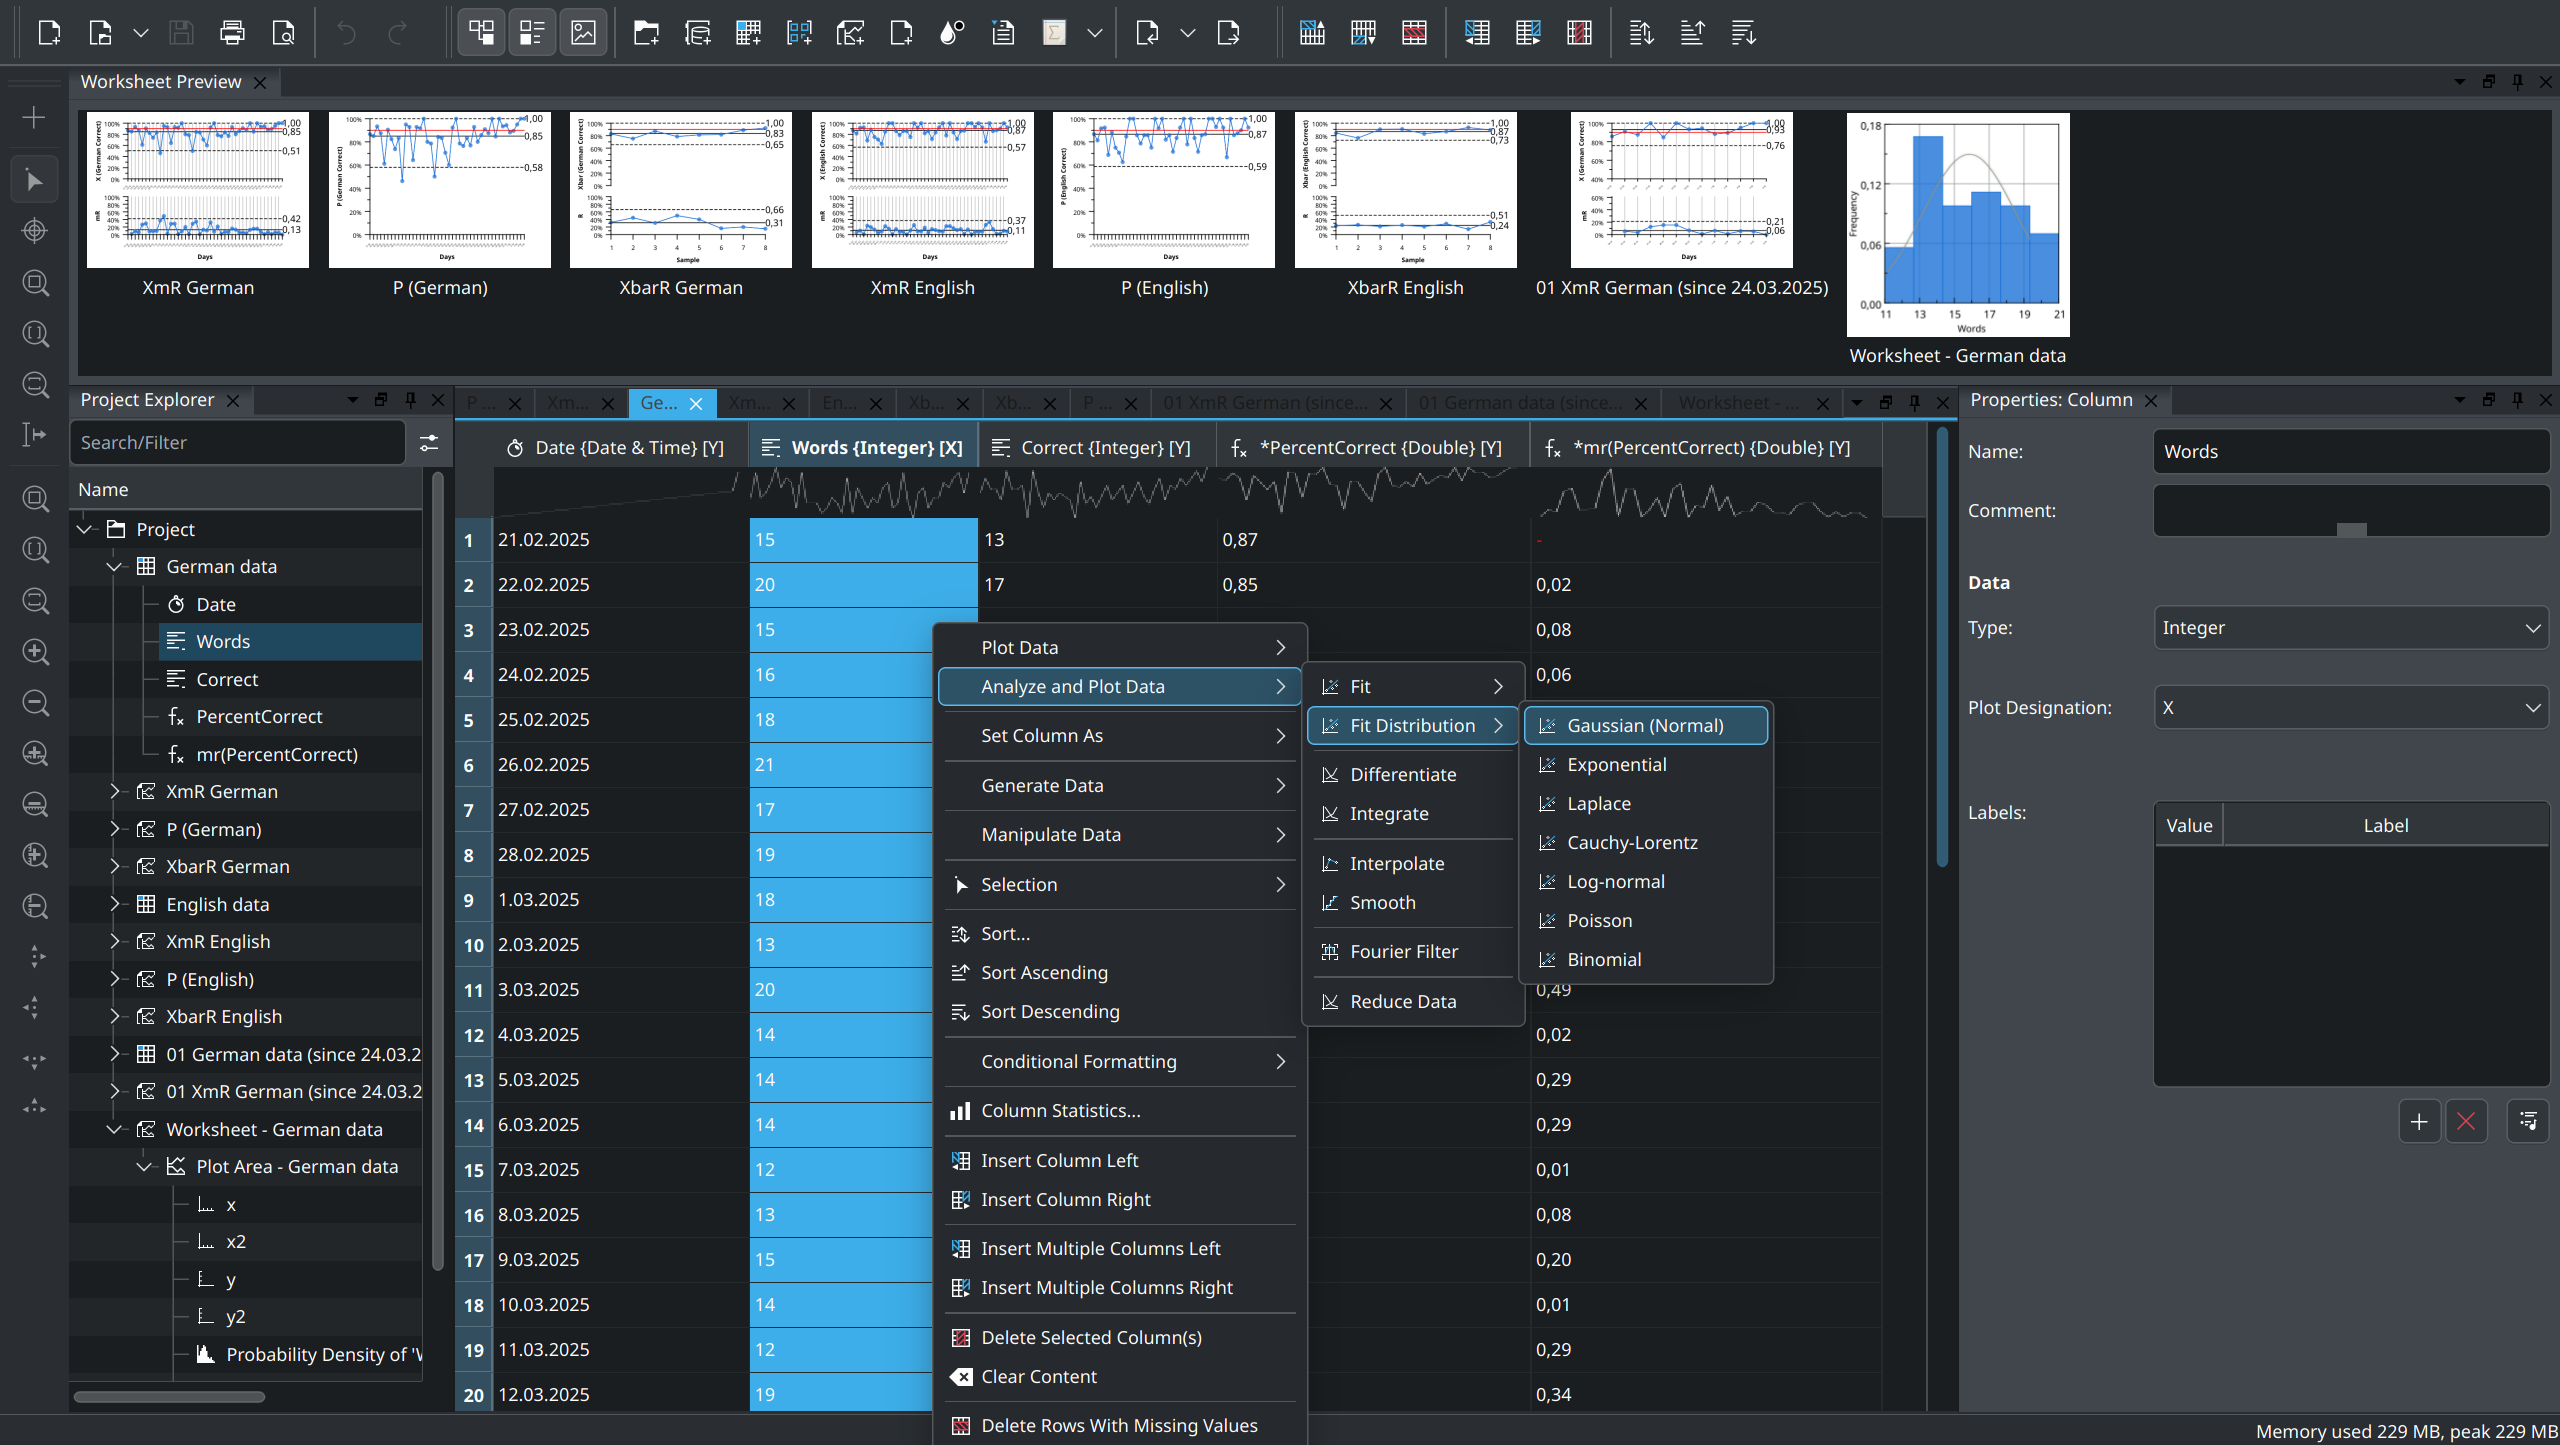
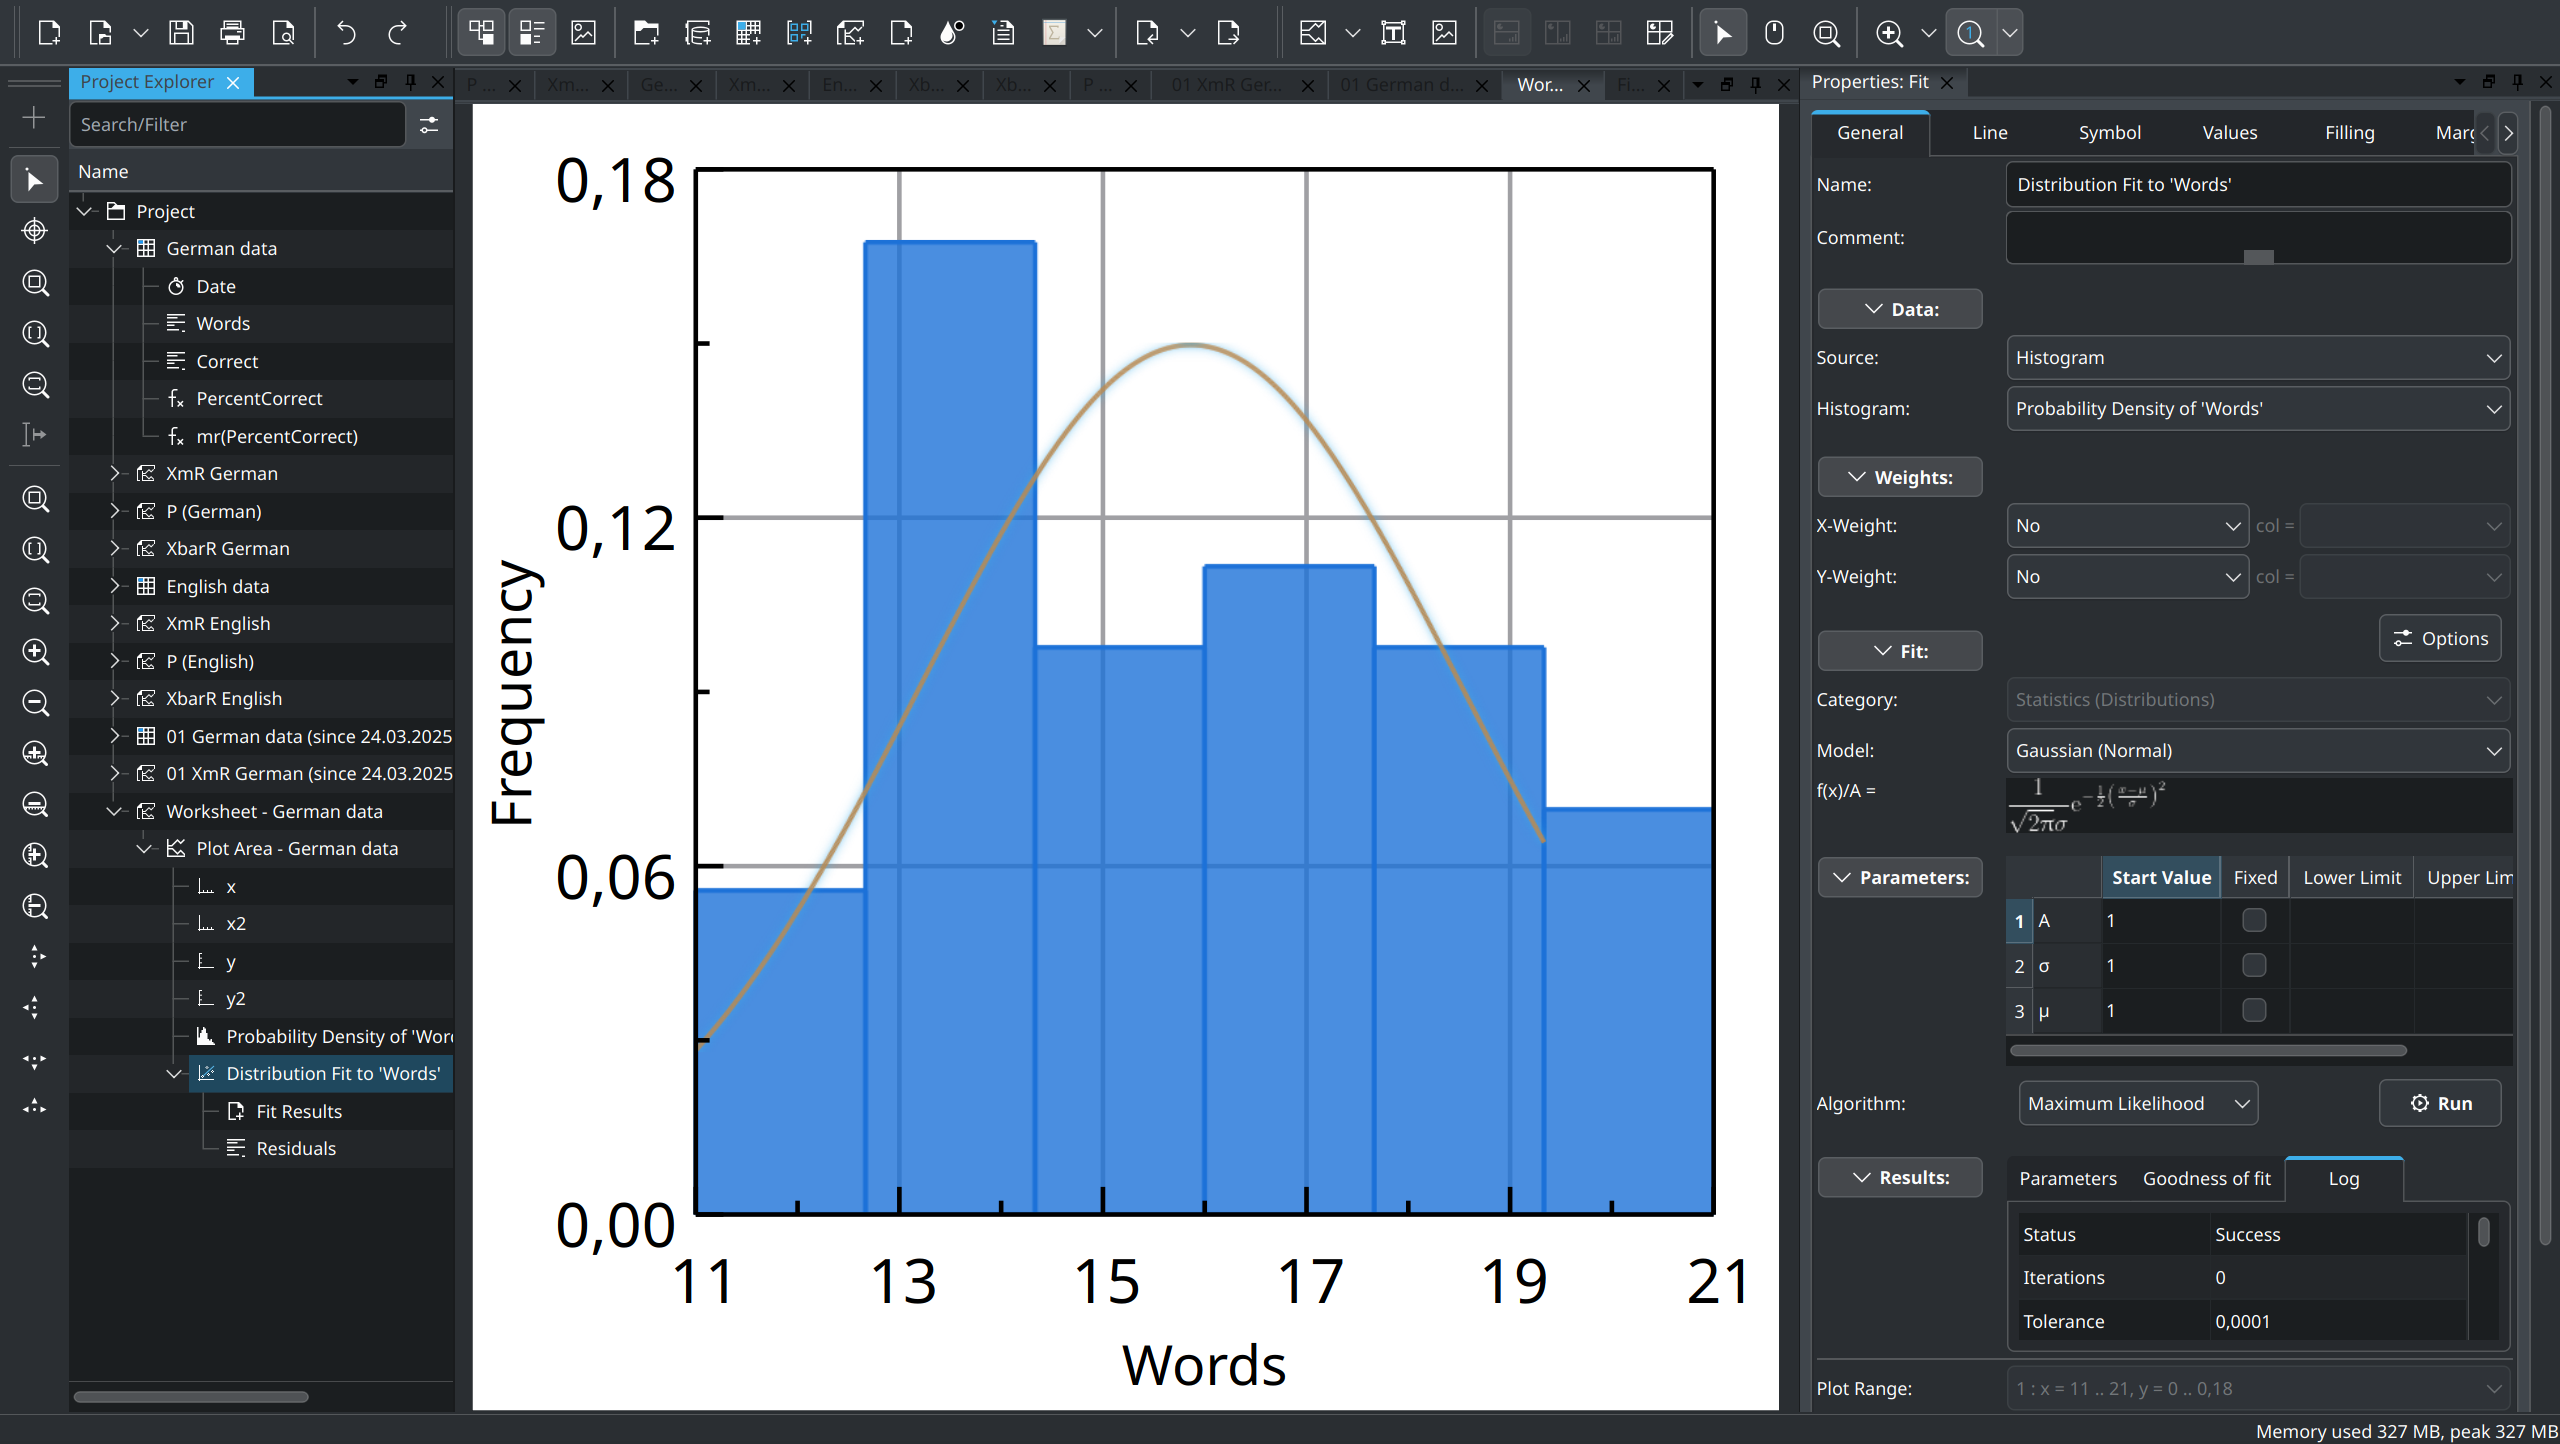
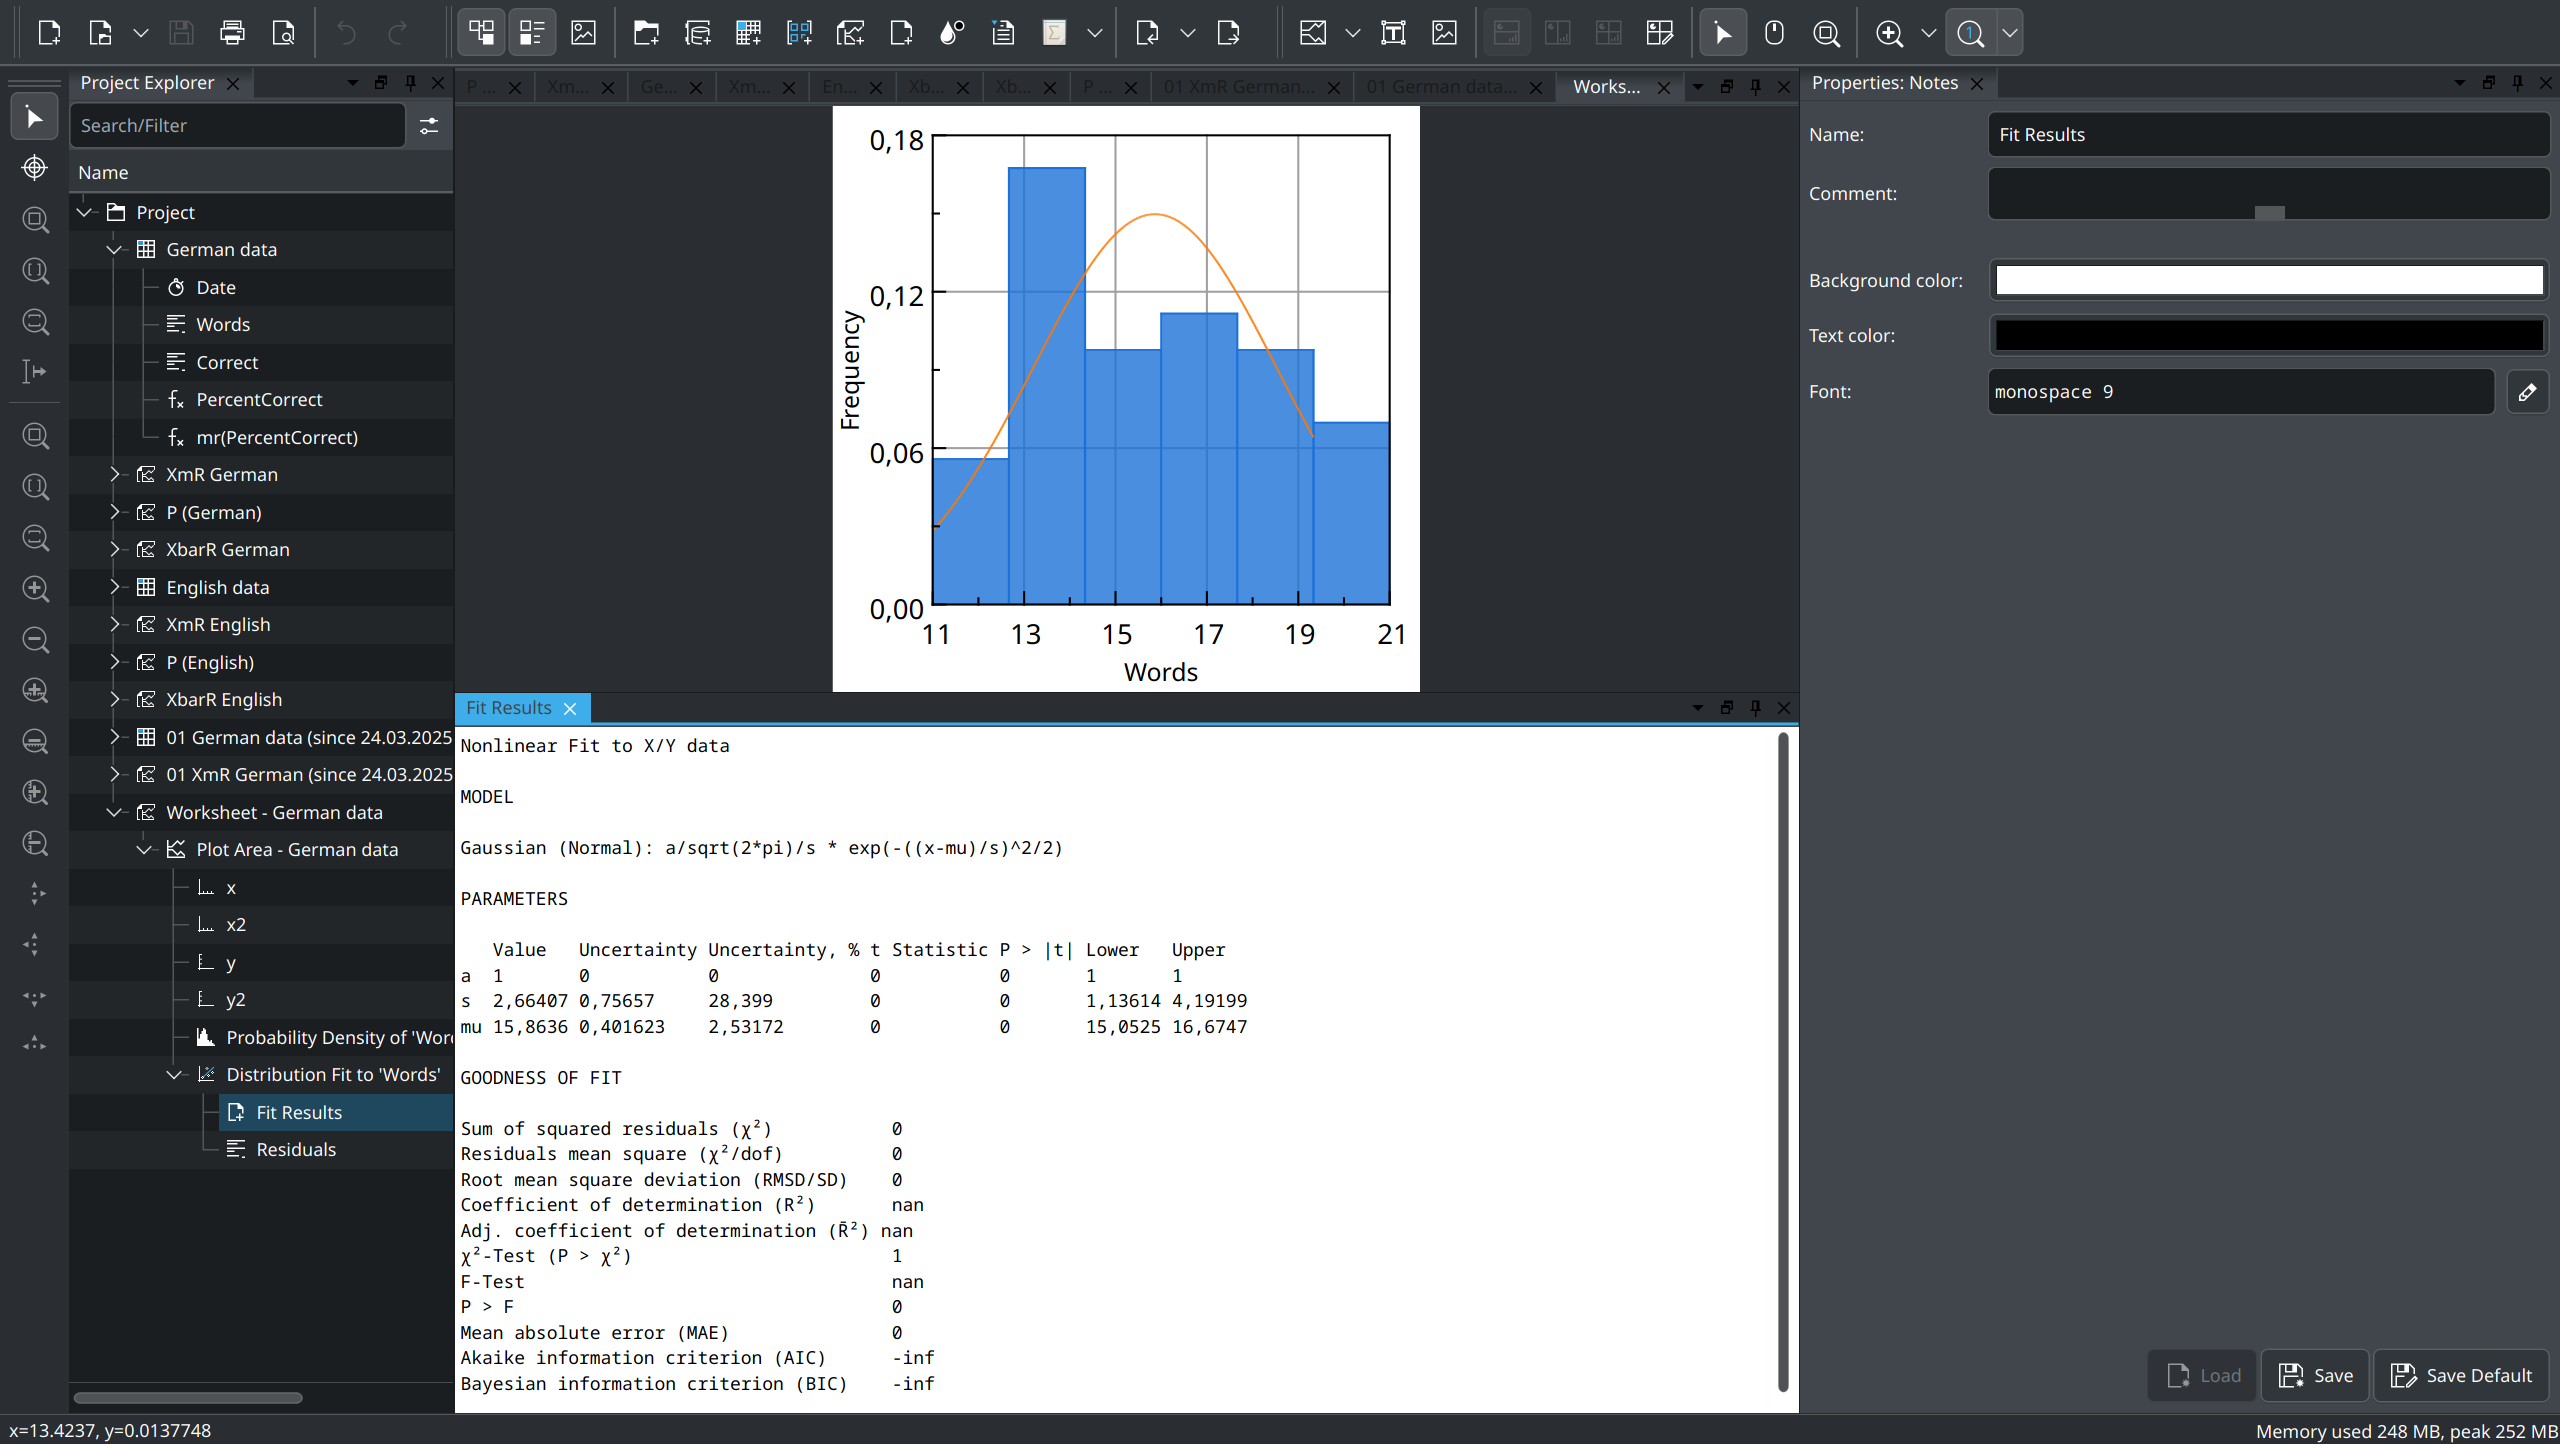
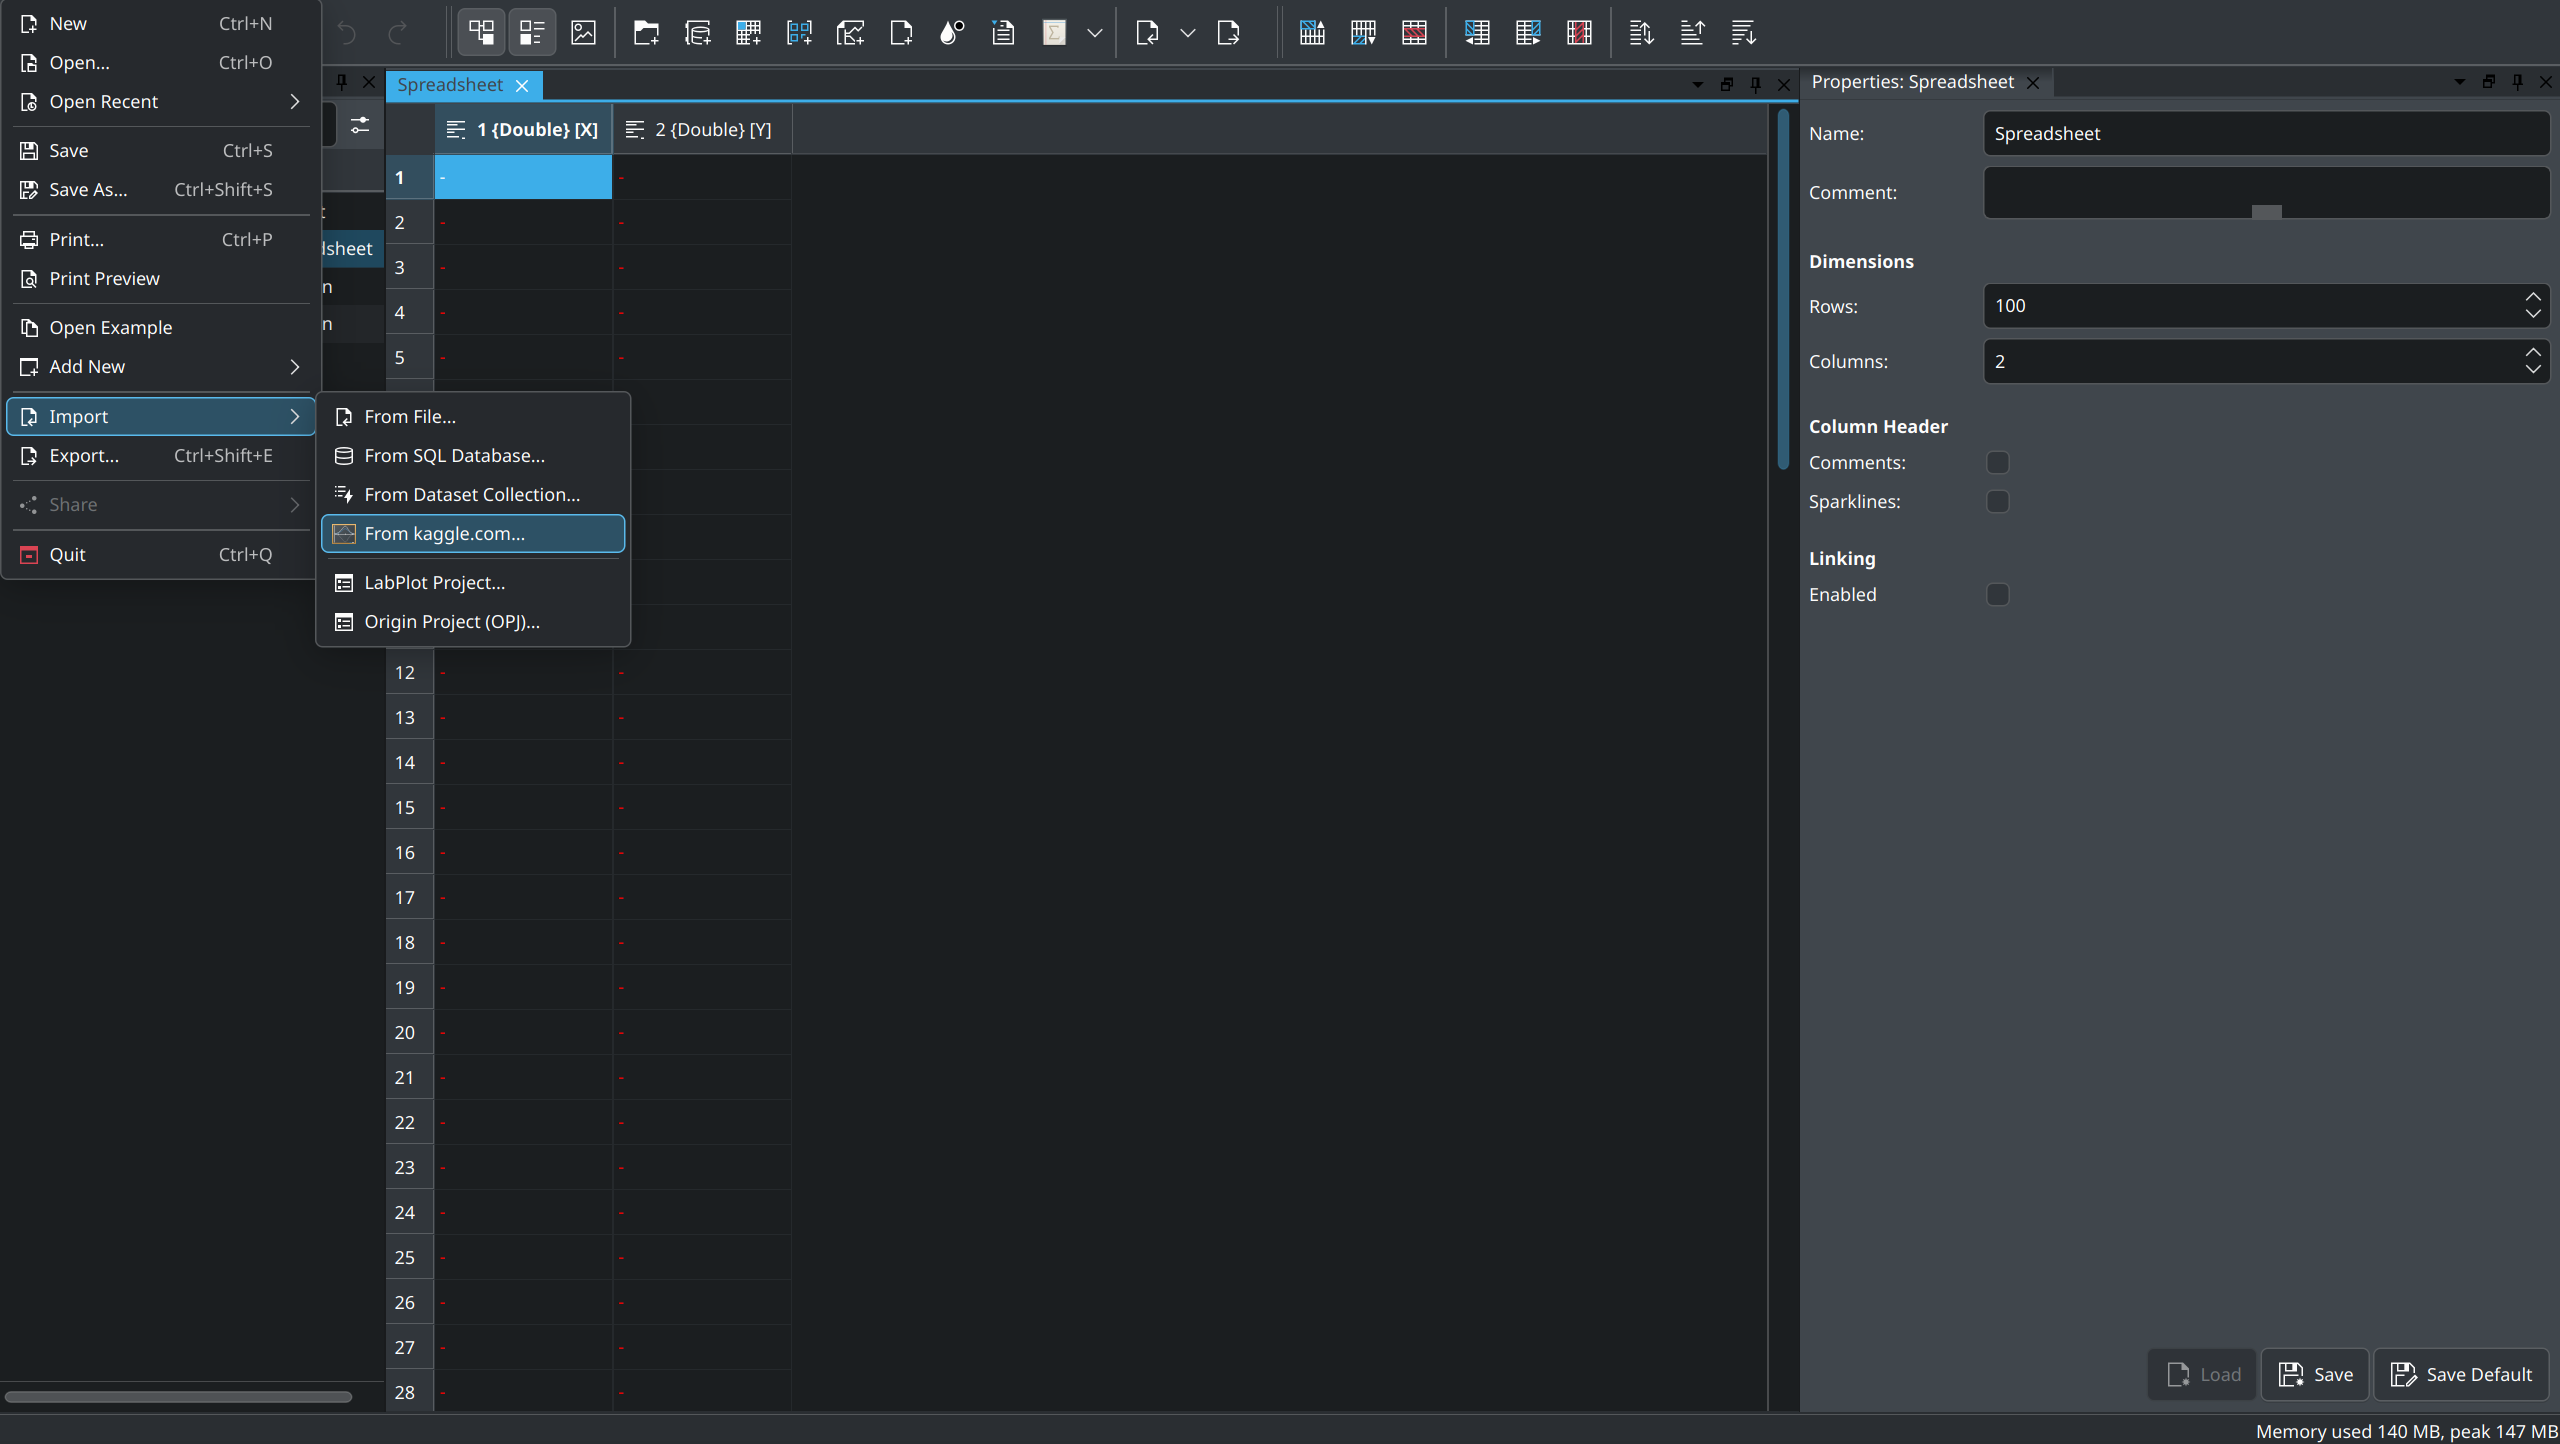
- You can now perform distribution fitting directly from the spreadsheet.
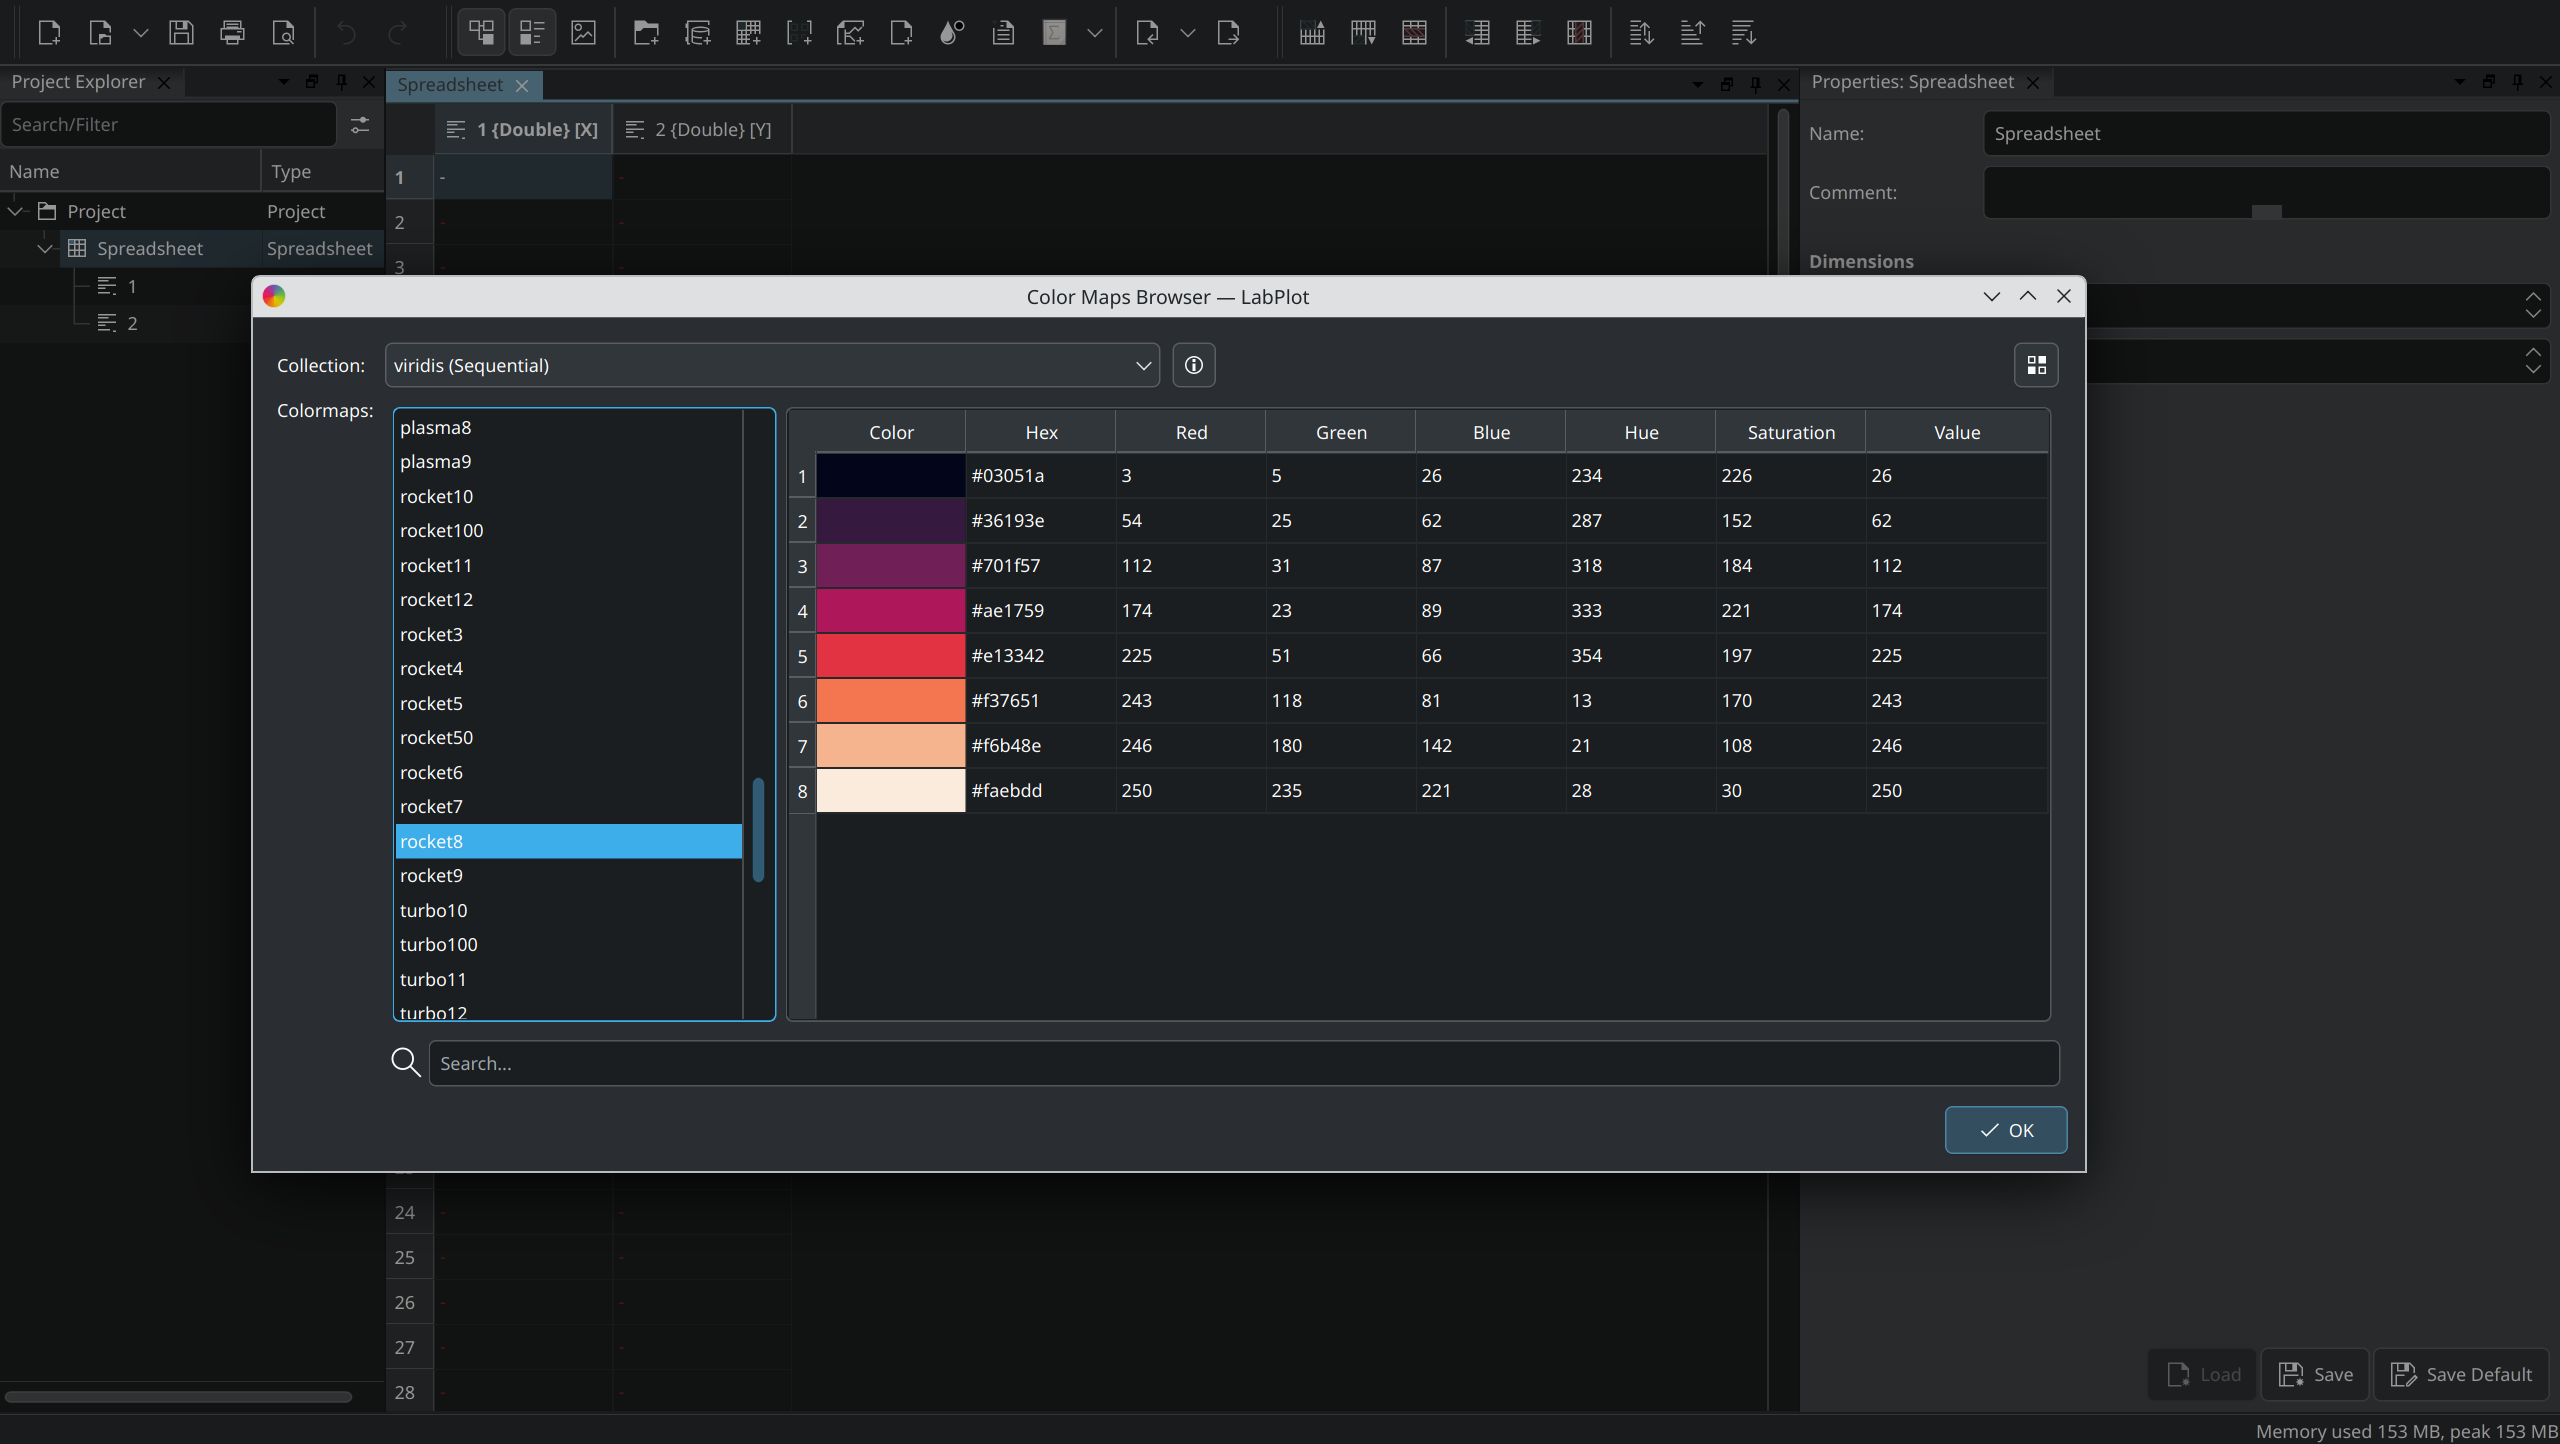
- You can use List View with Details in the Color Maps Browser.
- Parser performance has been significantly improved. The runtime of the benchmark test has decreased from 137 msec to 7.5 msec per iteration.
Analysis
Newly introduced analysis tools include:
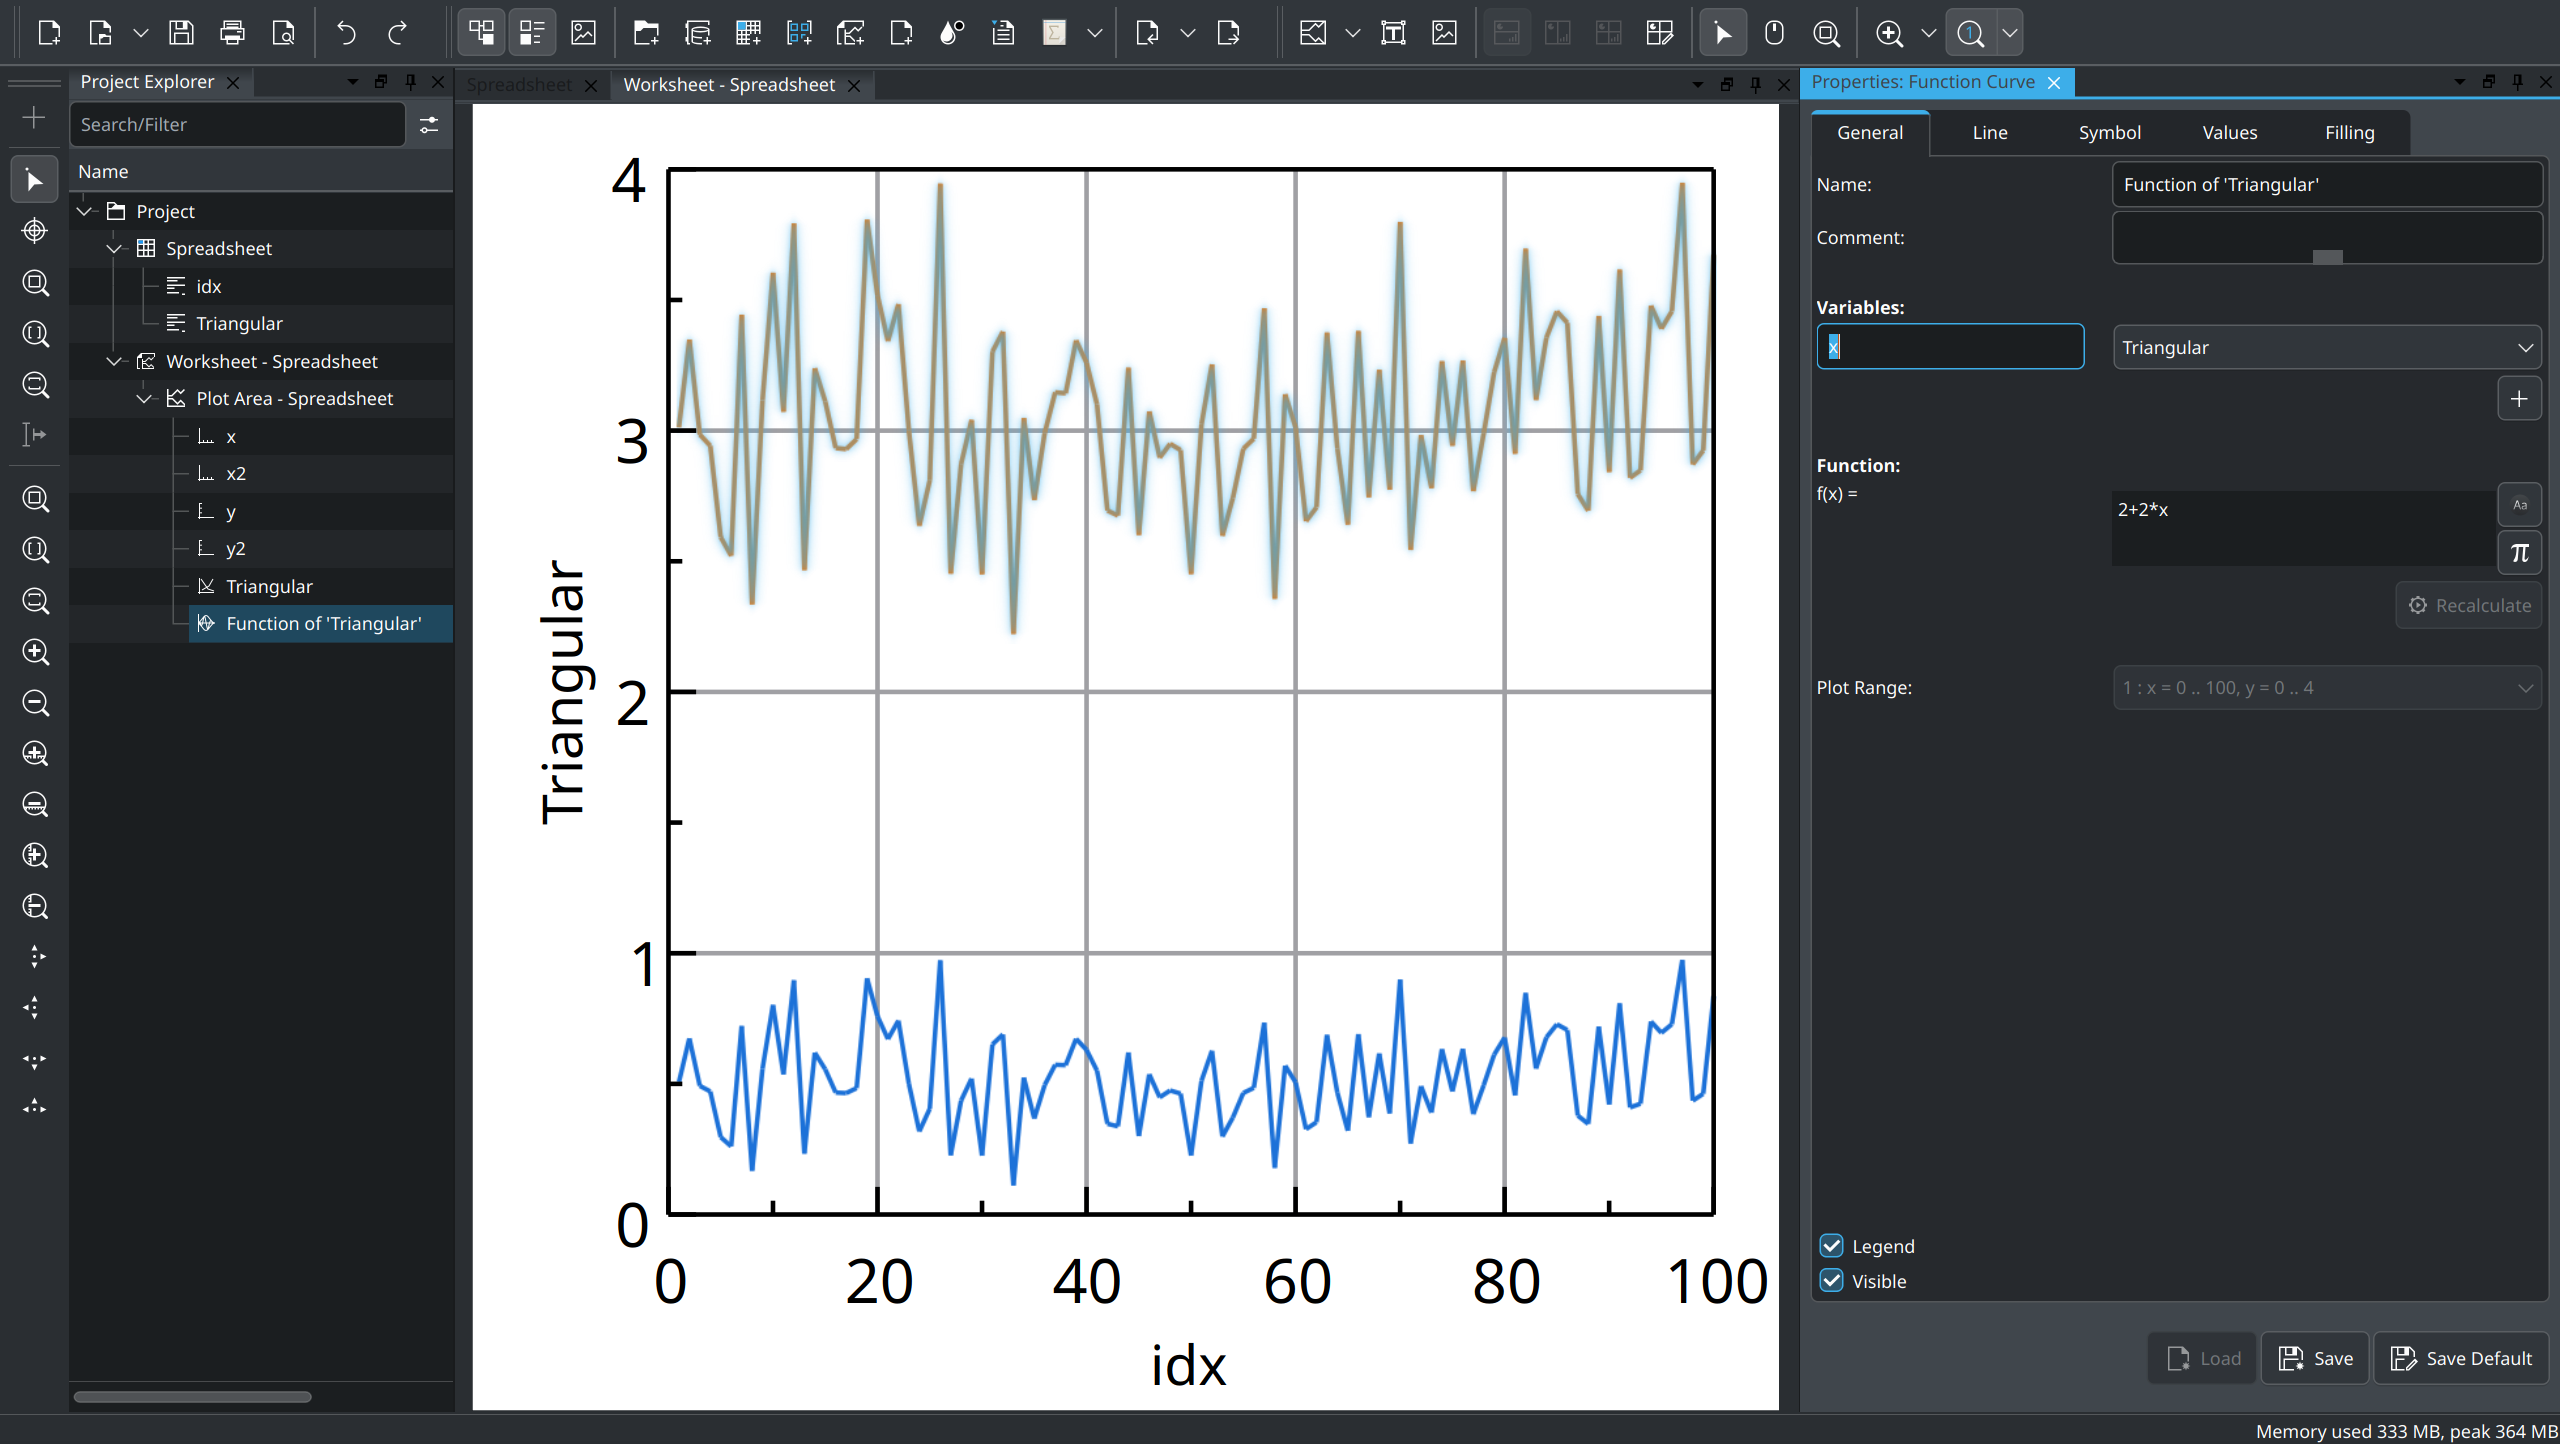
- You can now perform calculations on curves by defining a new curve as a function of another curve.
- The display of fit results has been enhanced with better color and alignment options.
- Conditional formatting, statistics spreadsheet, sparklines, plot data dialog, etc. have been integrated also for live data source spreadsheets.
Import/Export
Key new features related to the import and export functionality:
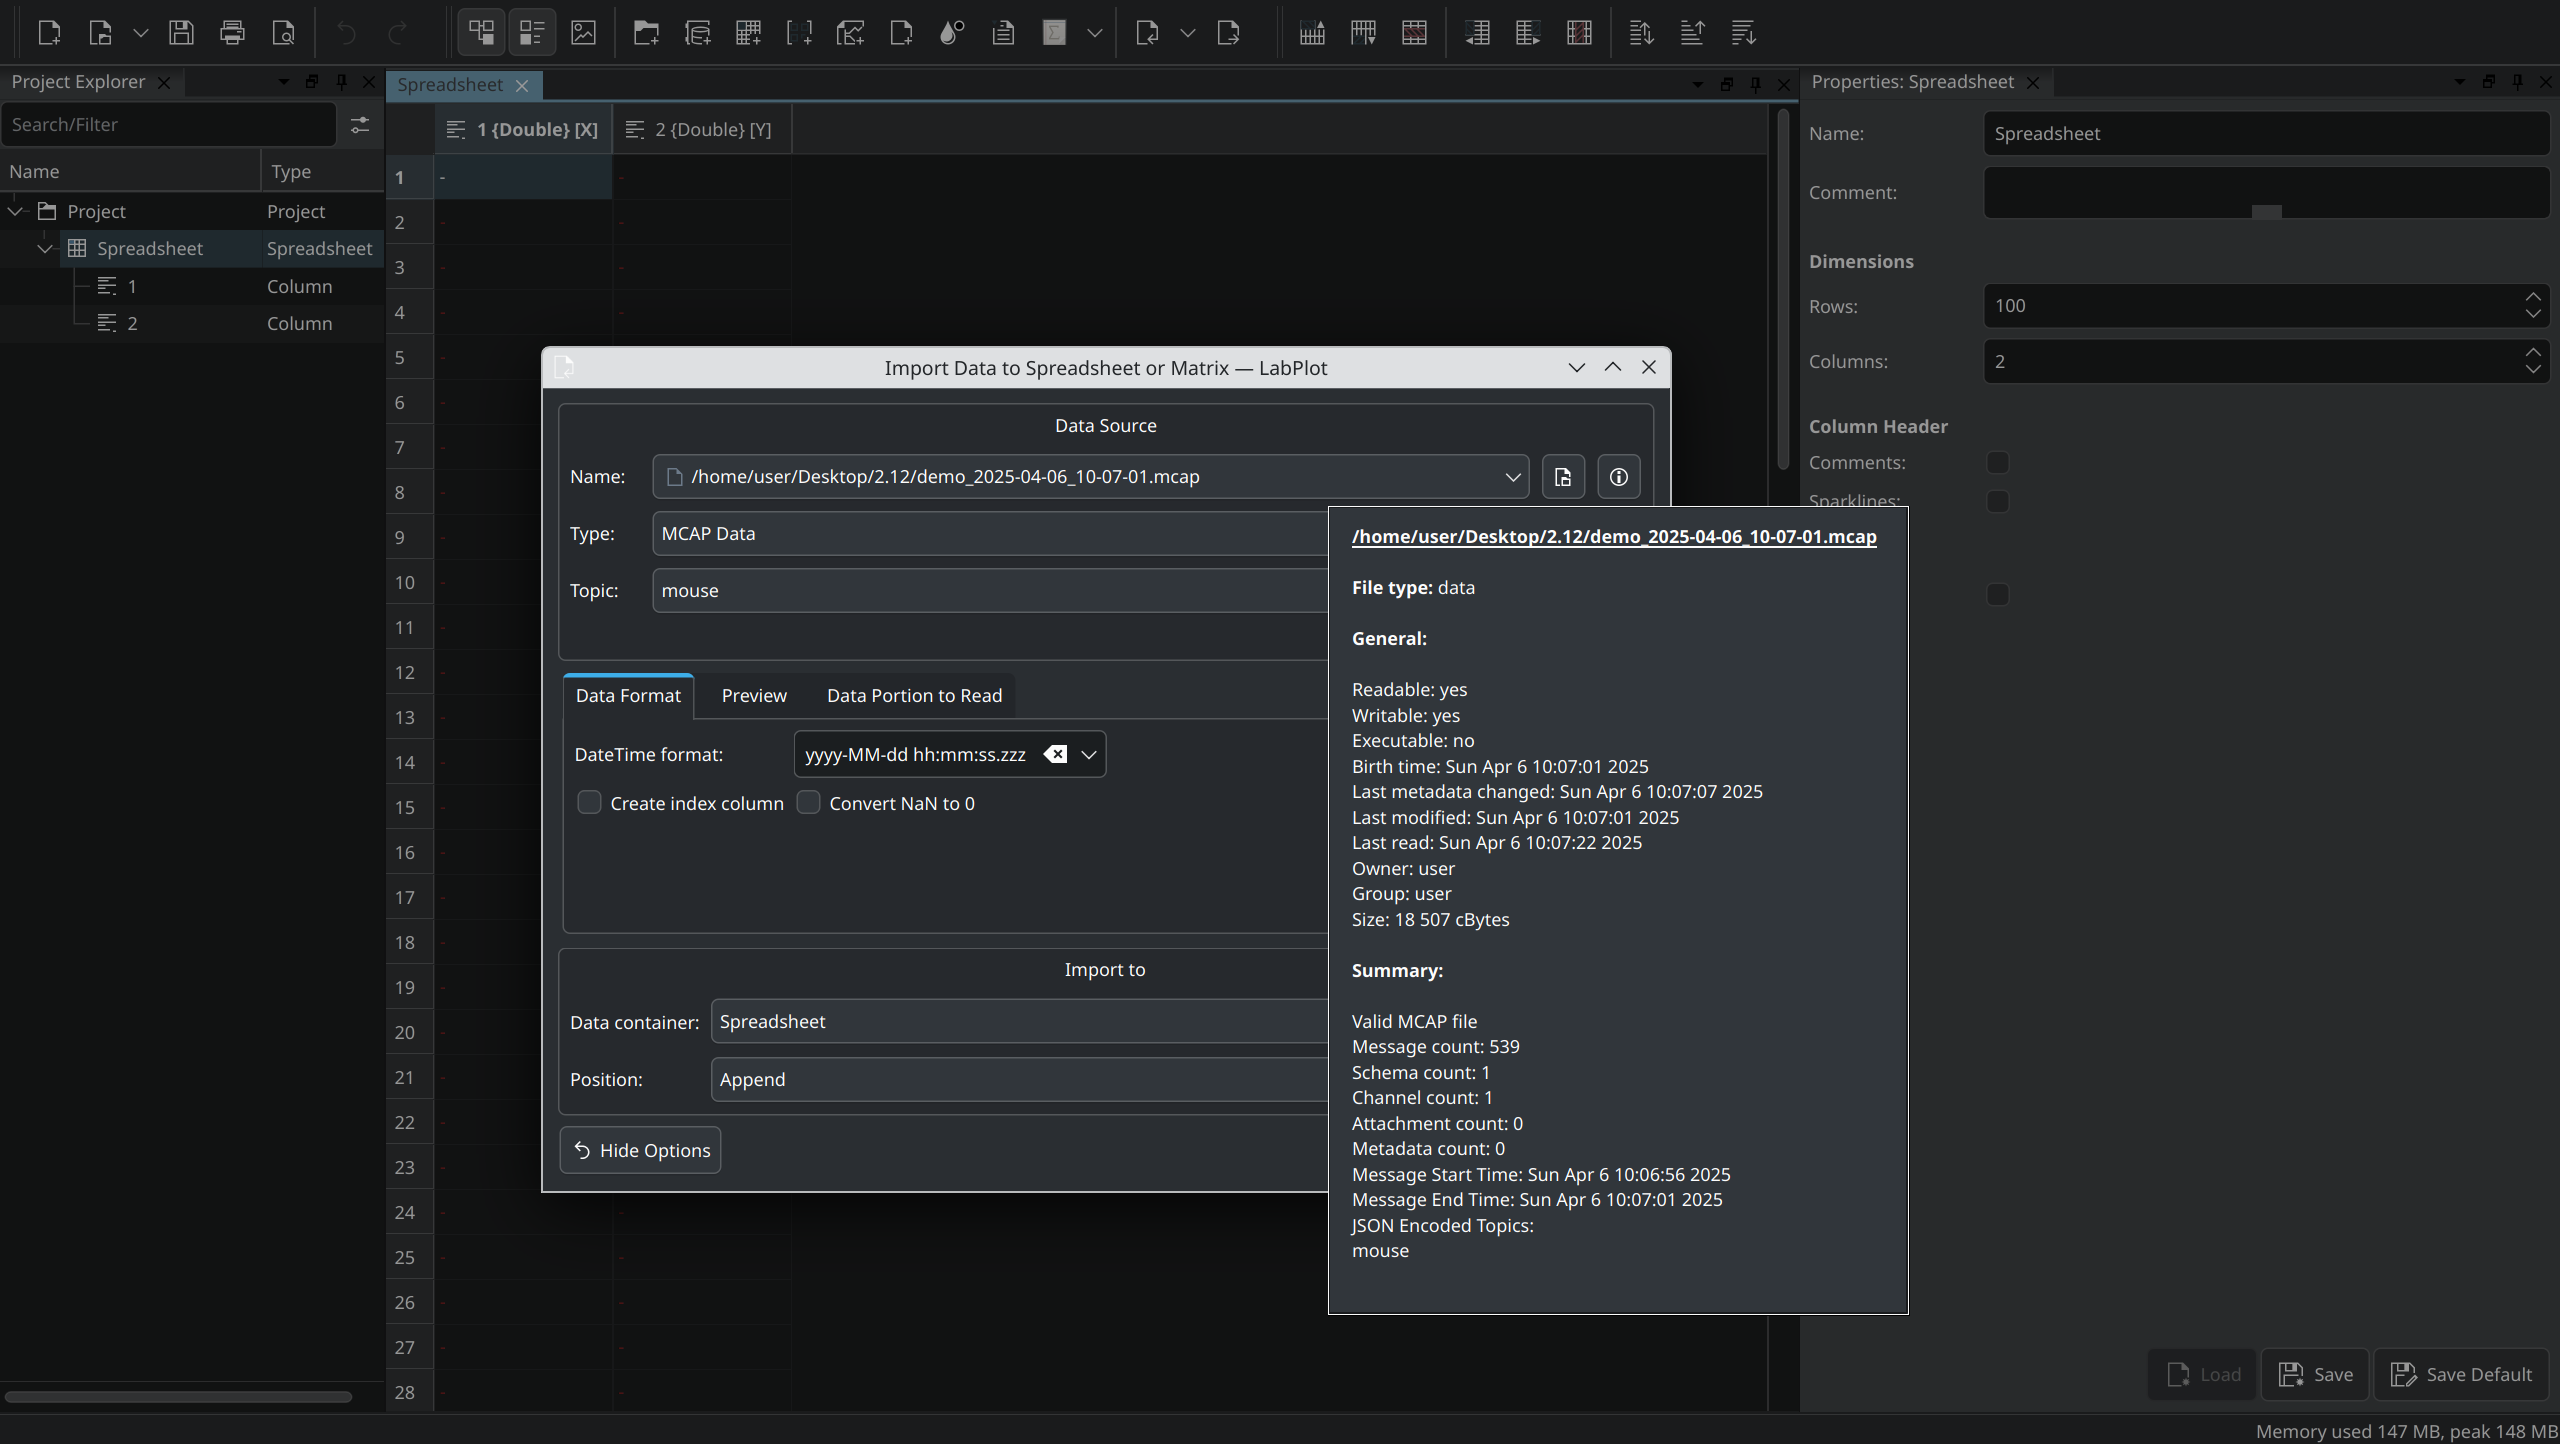
- Support for MCAP (Modular Container File Format) for multimodal log data has been added.
- You can now download datasets from kaggle.com directly into LabPlot.
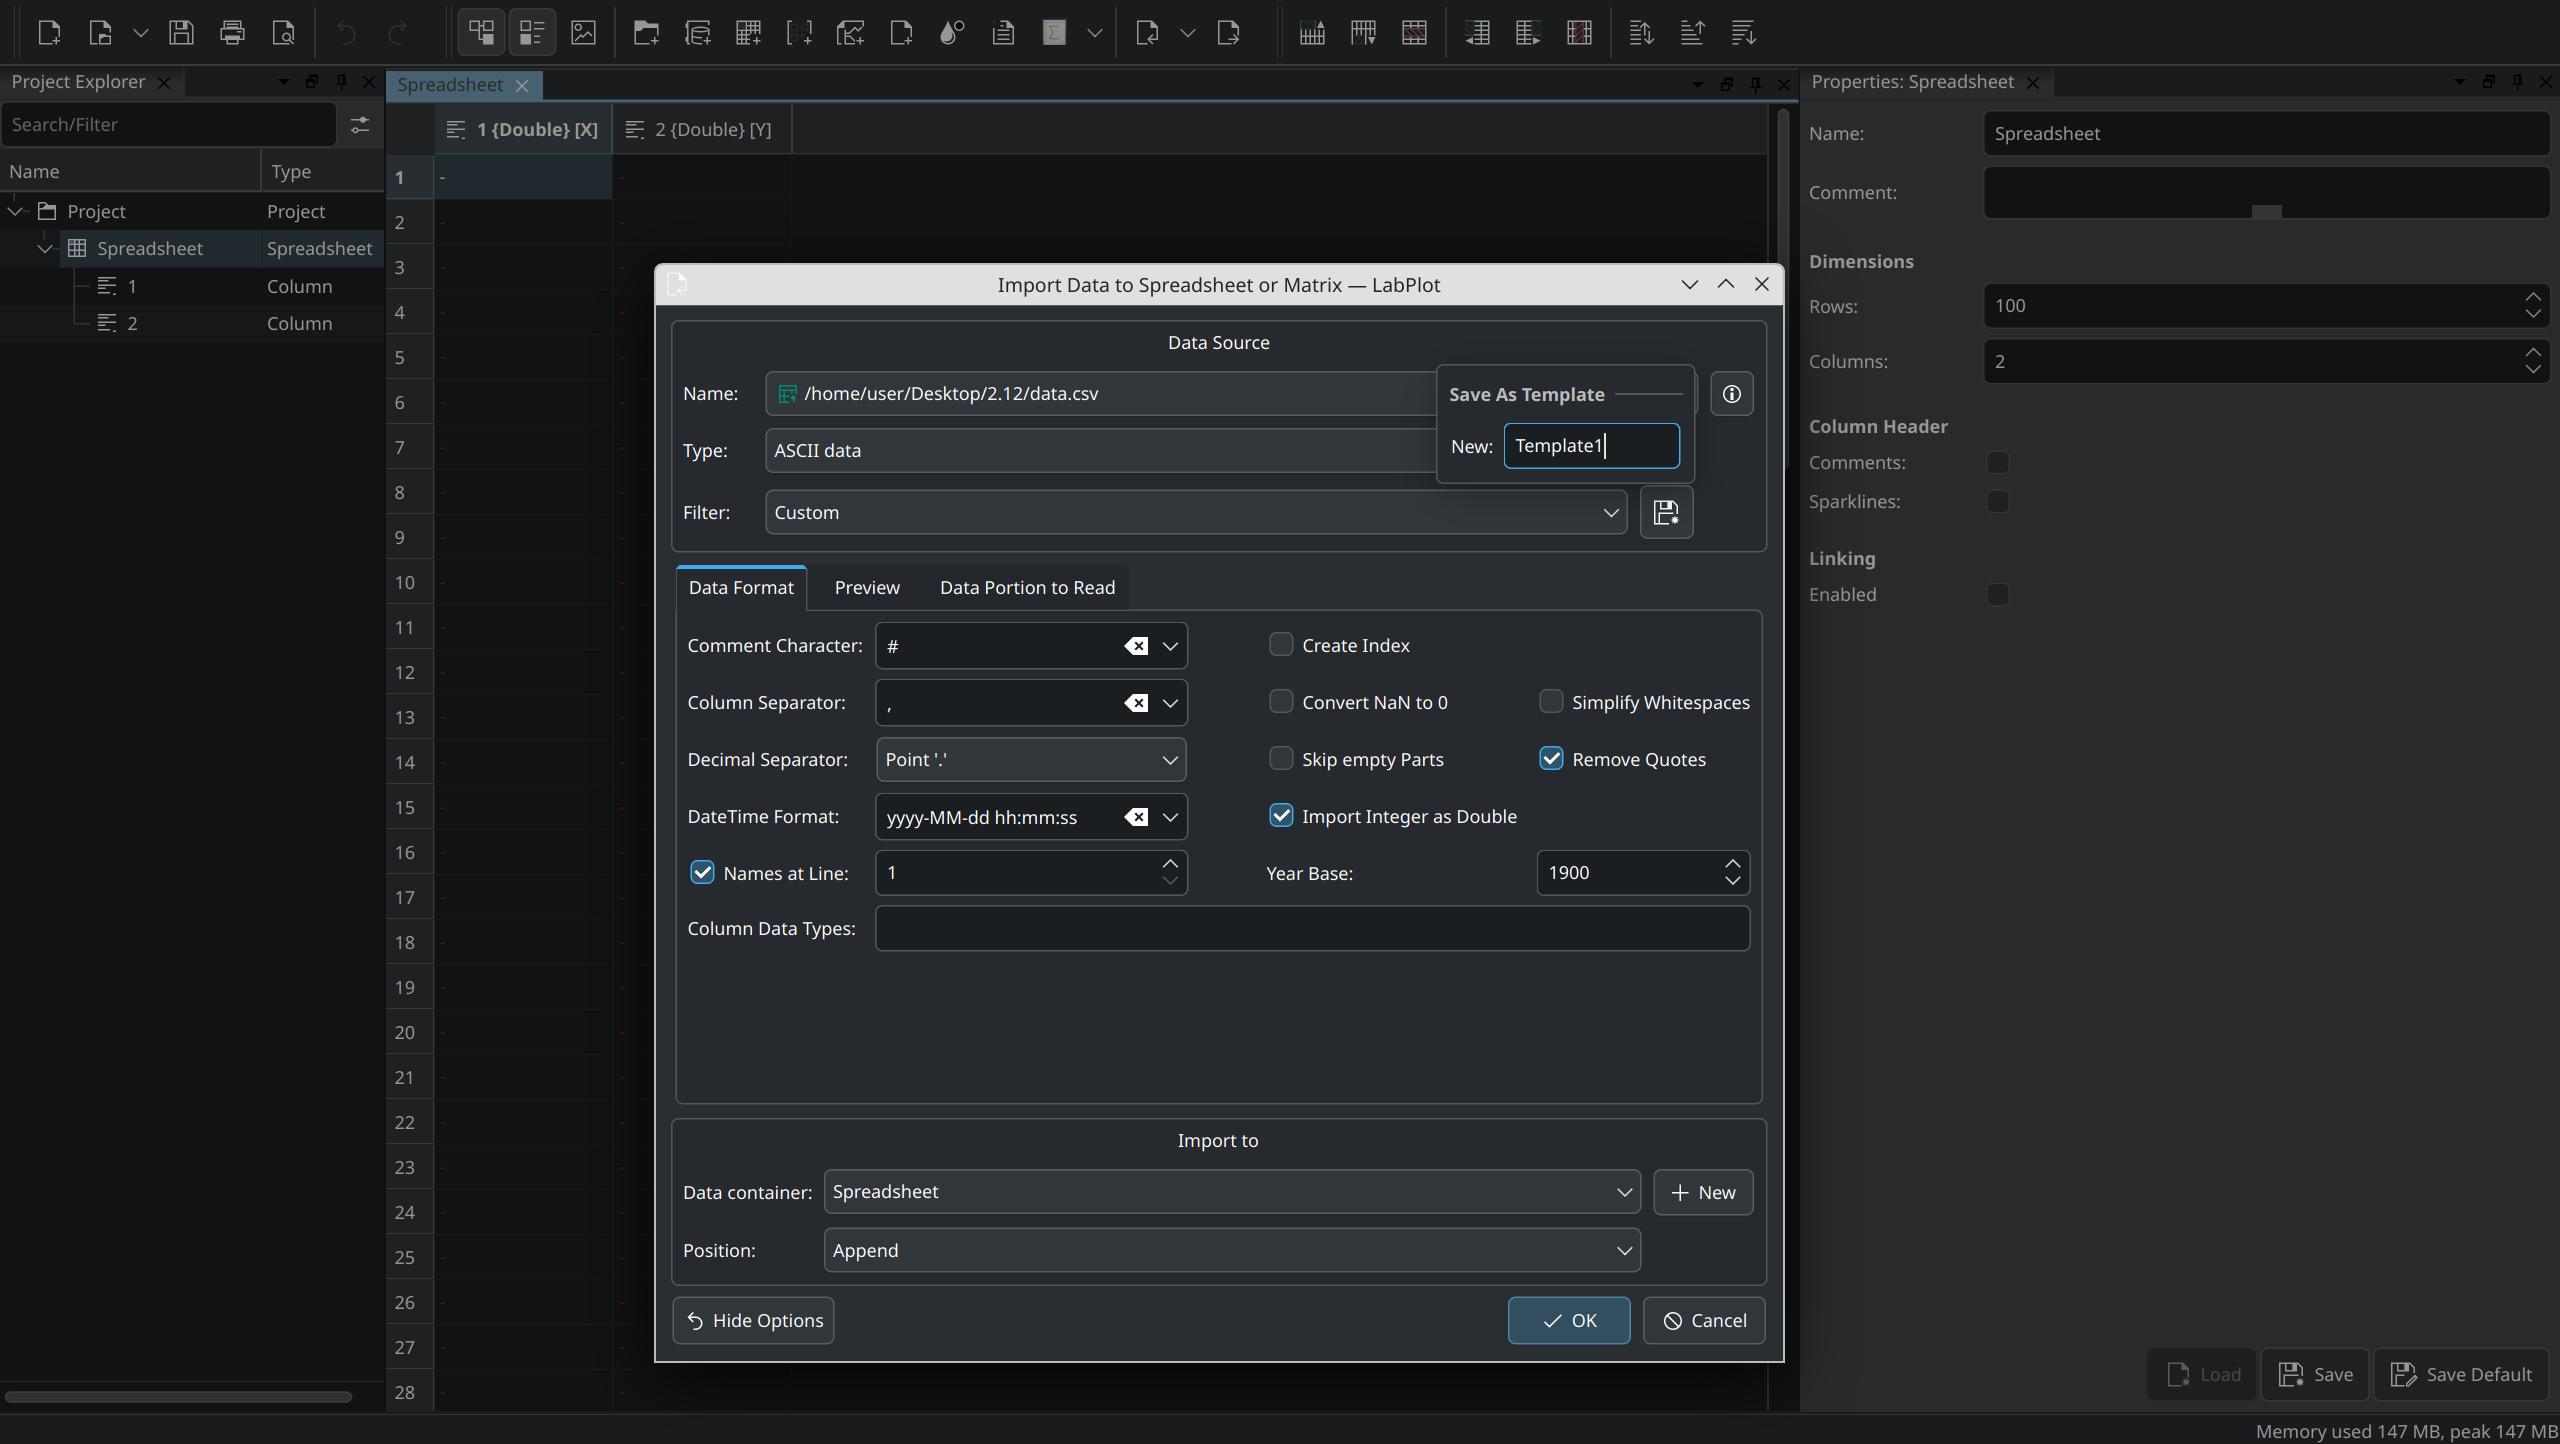
- LabPlot allows you to select a matching import filter to facilitate management of various data import configurations.
- Better error messages for data import, missing device permissions and file preview issues.
- We have enabled reading live data with multiple columns via UDP, local sockets, and serial ports.
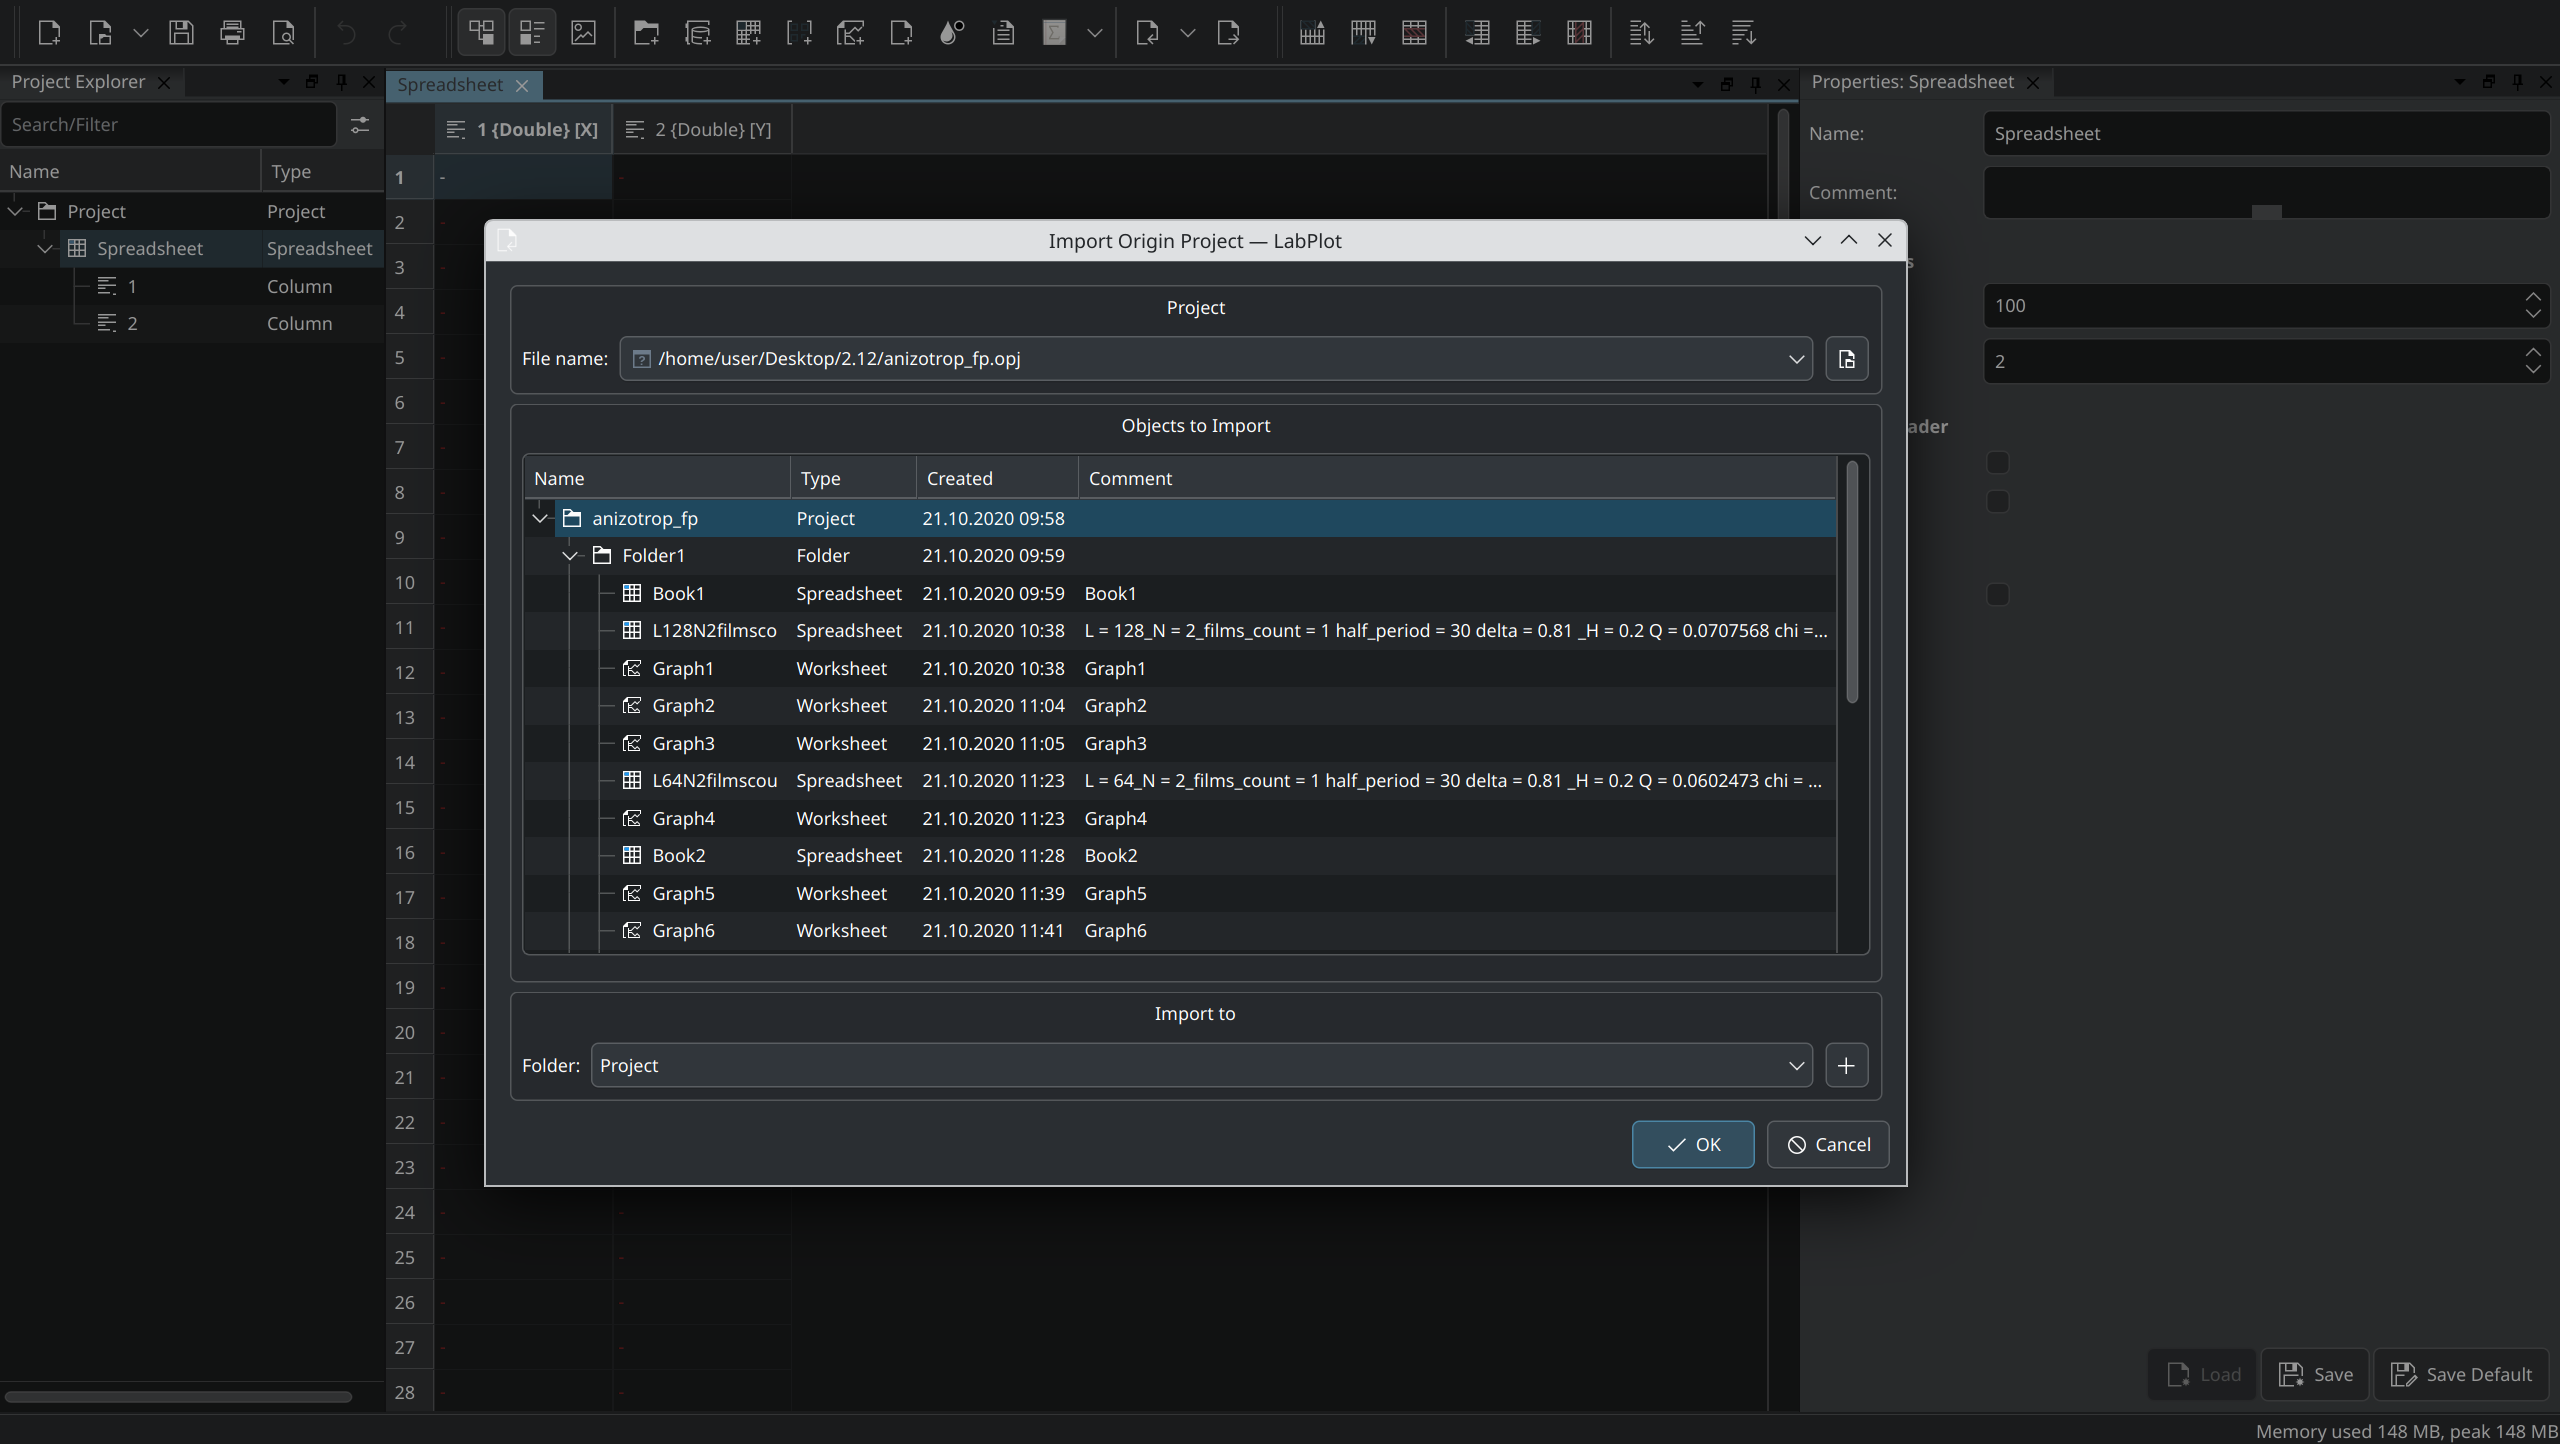
- Improved treating of multilayer graphs when opening OPJ (Origin) projects.
- Faster import of big ASCII files on Windows is now possible.
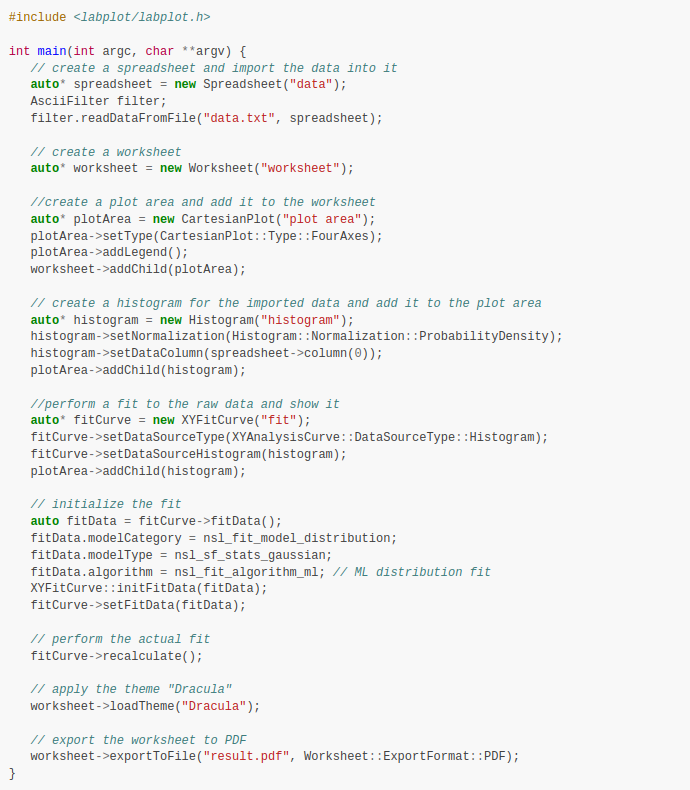
Software Development Kit
Although this part of LabPlot is still considered experimental, it has received multiple improvements in 2.12
- Shared library including the core functionality of LabPlot as part of the installation that can be used in external projects
- Refactoring, improved naming conventions and reduced dependencies in the public API
- New documentation including instructions for how to install and to use the SDK as well as code examples for some of the typical use cases
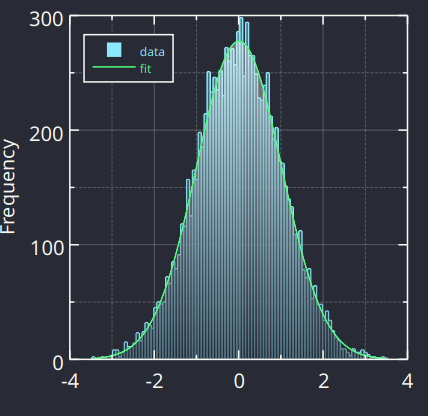
It will be great to have Gamma fit to get scale and shape parameters.
Many thanks.
Best Regards,
Jaideep
The Gamma function is already available in LabPlot. Please, see the attached image.
https://postimg.cc/2bh1DN39