LabPlot 2.10 released
Today we are announcing the availability of the latest release of LabPlot: Say hello to LabPlot 2.10!
This release comes with many new features, improvements and performance optimizations in different areas, as well as with support for new data formats and visualization types.
The major new features are introduced below. For a more detailed review of the changes in this new release, please refer to the ChangeLog file.
The source code of LabPlot, the Flatpak and Snap packages for Linux, as well as the installer for Windows and the image for macOS are available from our download page.
What’s new in 2.10?
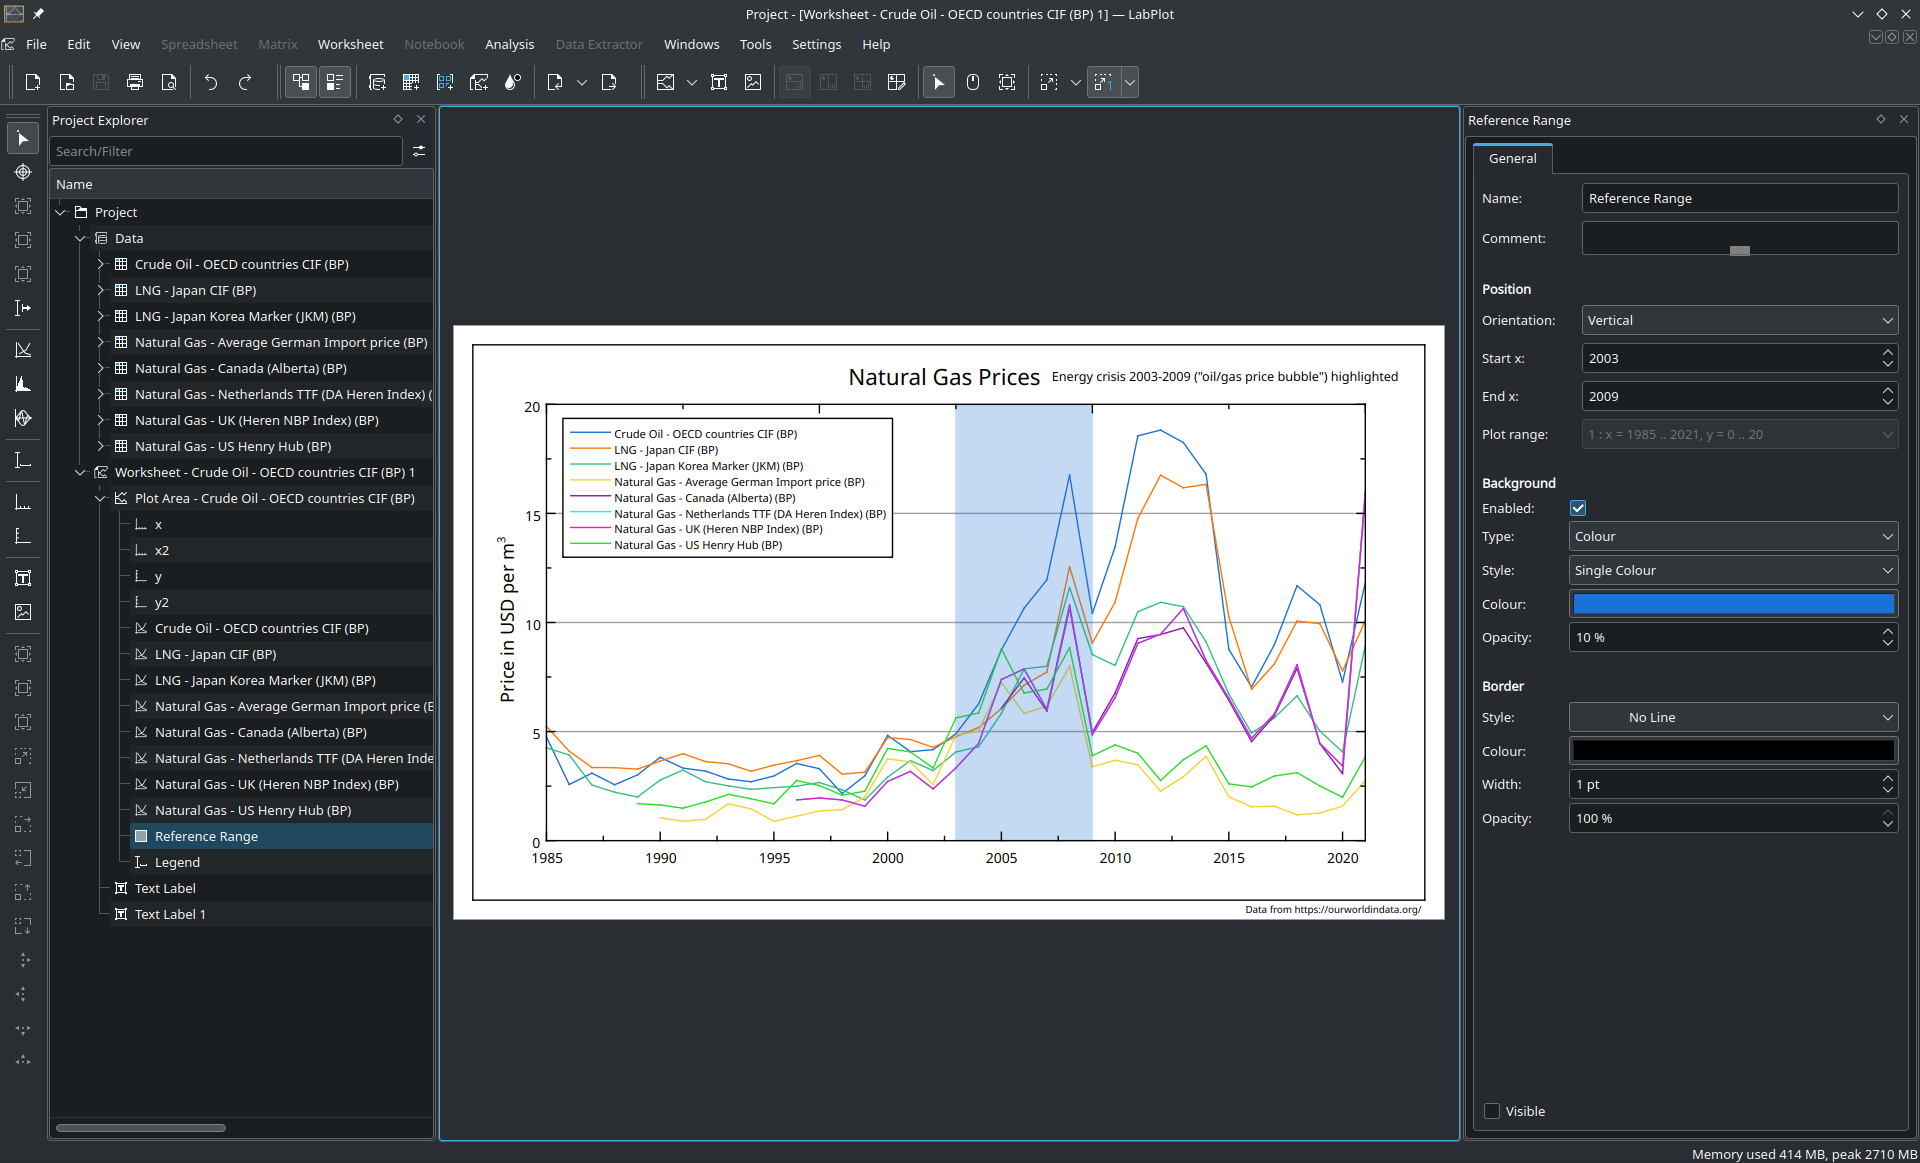
Worksheet
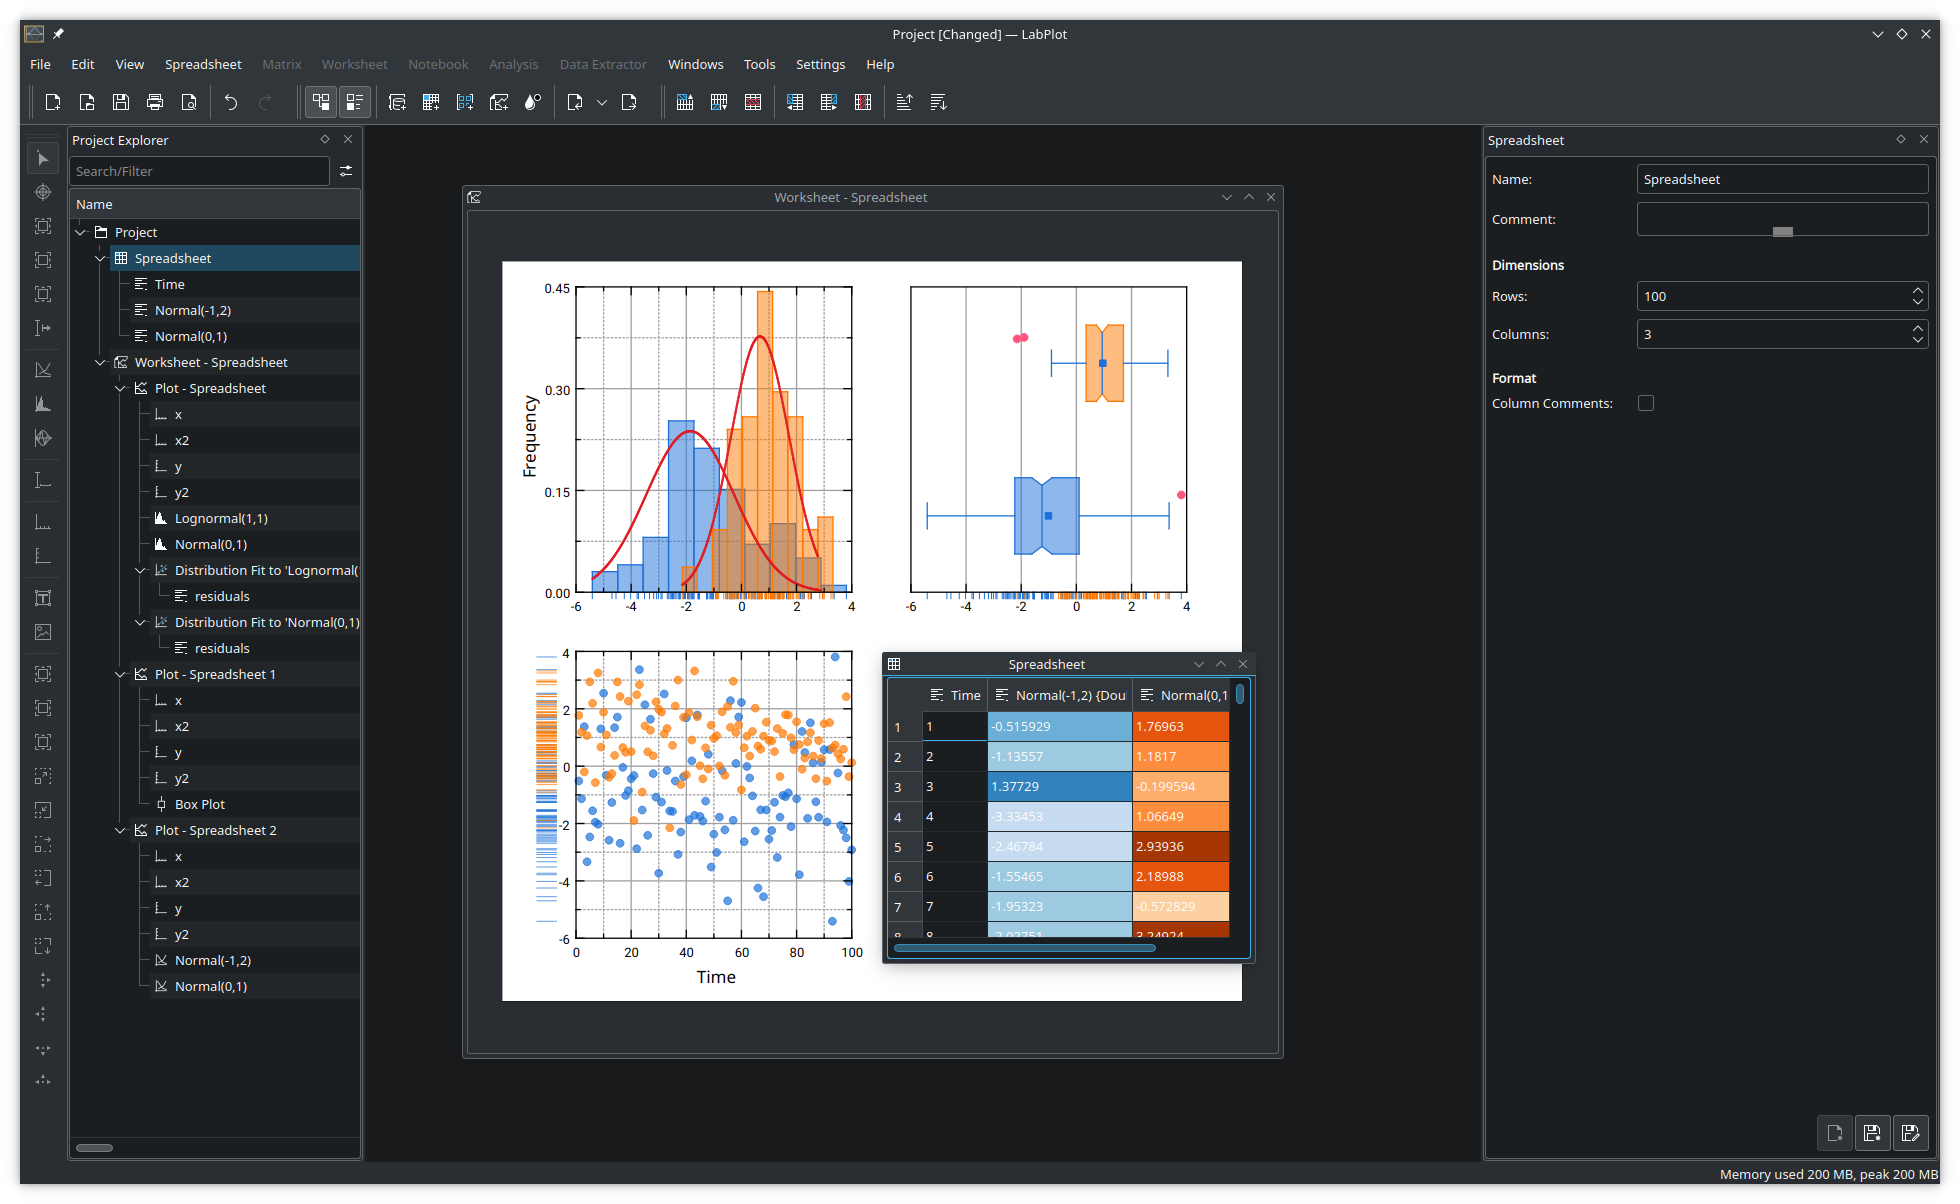
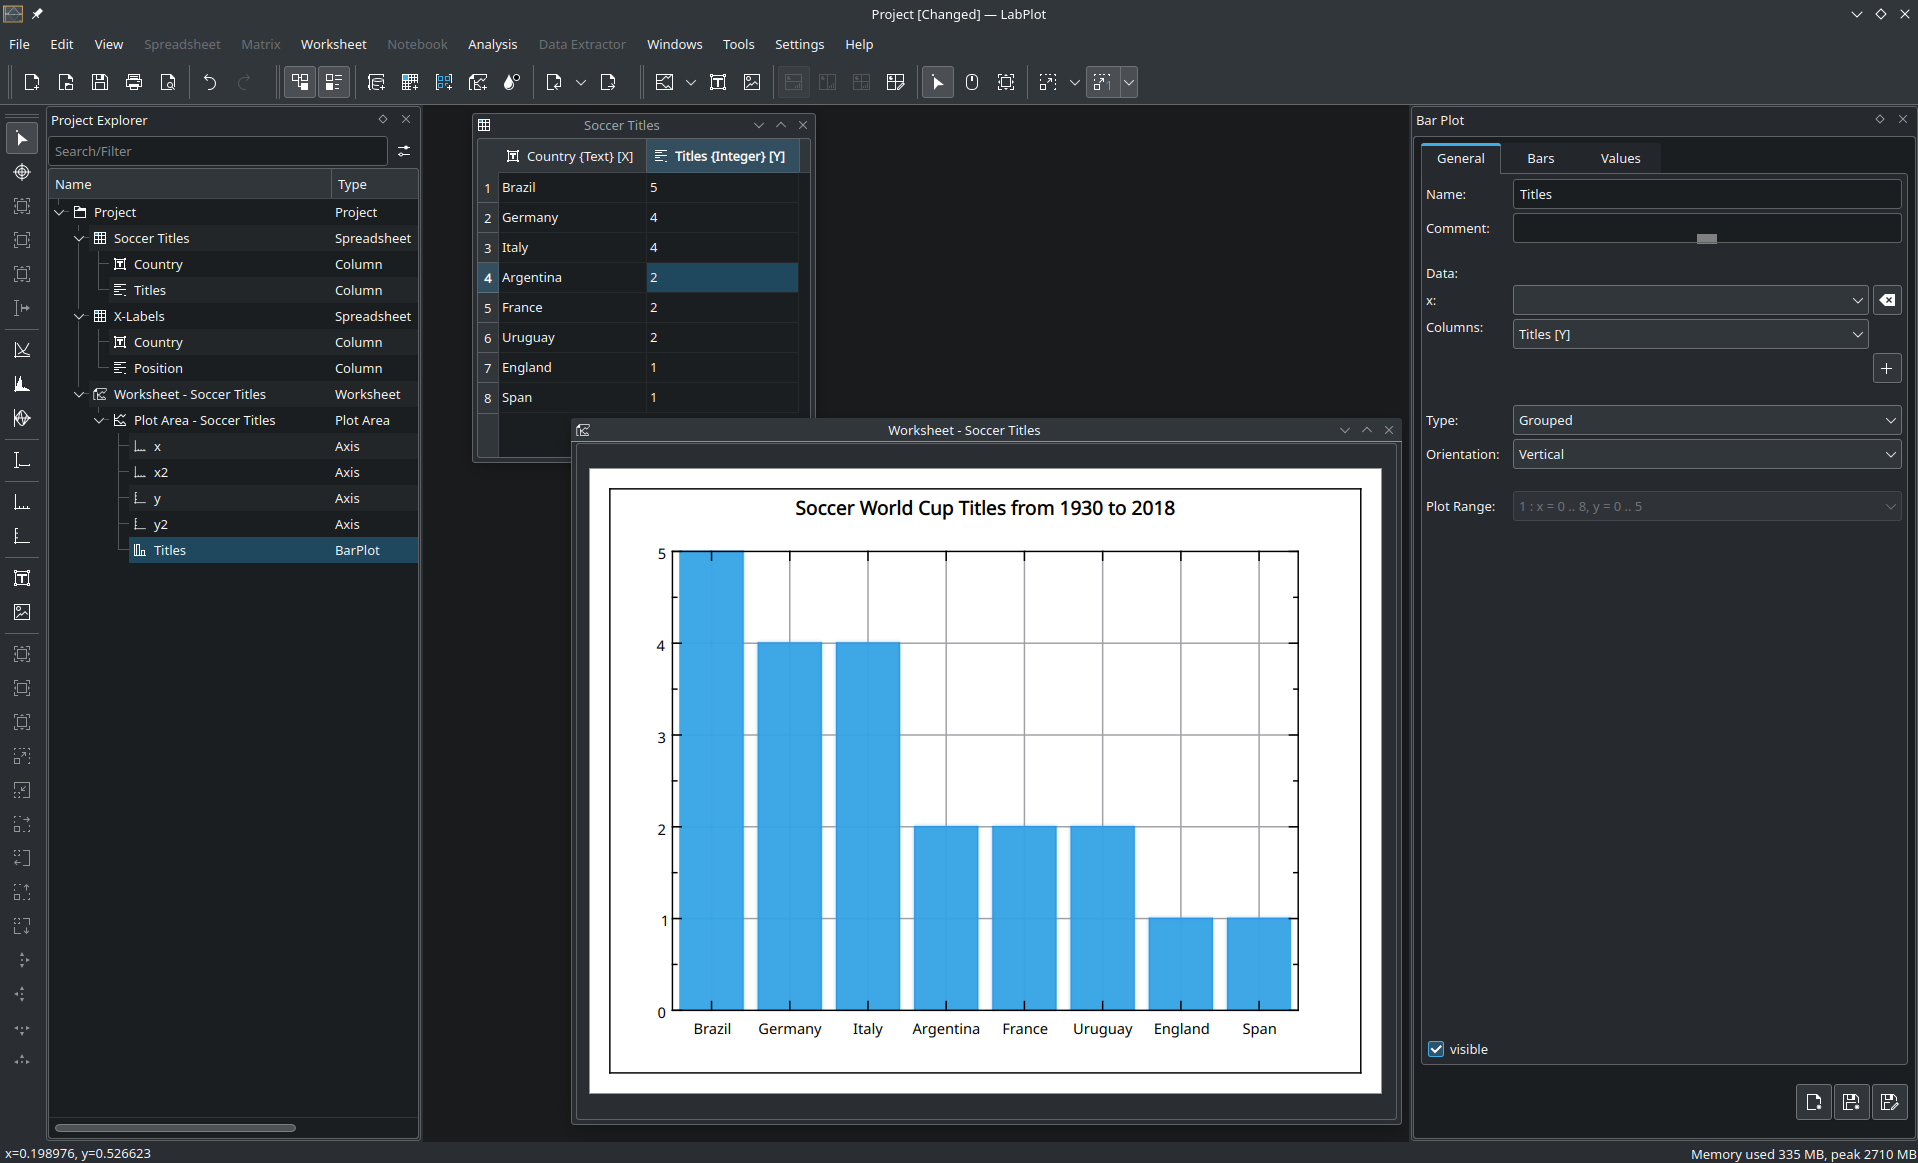
LabPlot’s worksheet comes with new visualizations and more advanced plots, including:
Bar plots
Plot templates that allow you to save and re-use custom plot configurations
Error bars in histograms
Rug plots for box plots and histograms
More flexible and customizable box plots
Reference ranges, that is, custom areas on the plot to highlight x- and y-ranges
LaTeX error messages in text labels when rendering with LaTeX
Spreadsheet
The Spreadsheets gain more functions and operations to modify and generate data:
Data sampling (random and periodic methods)
Data flattening to convert pivoted data to column base format
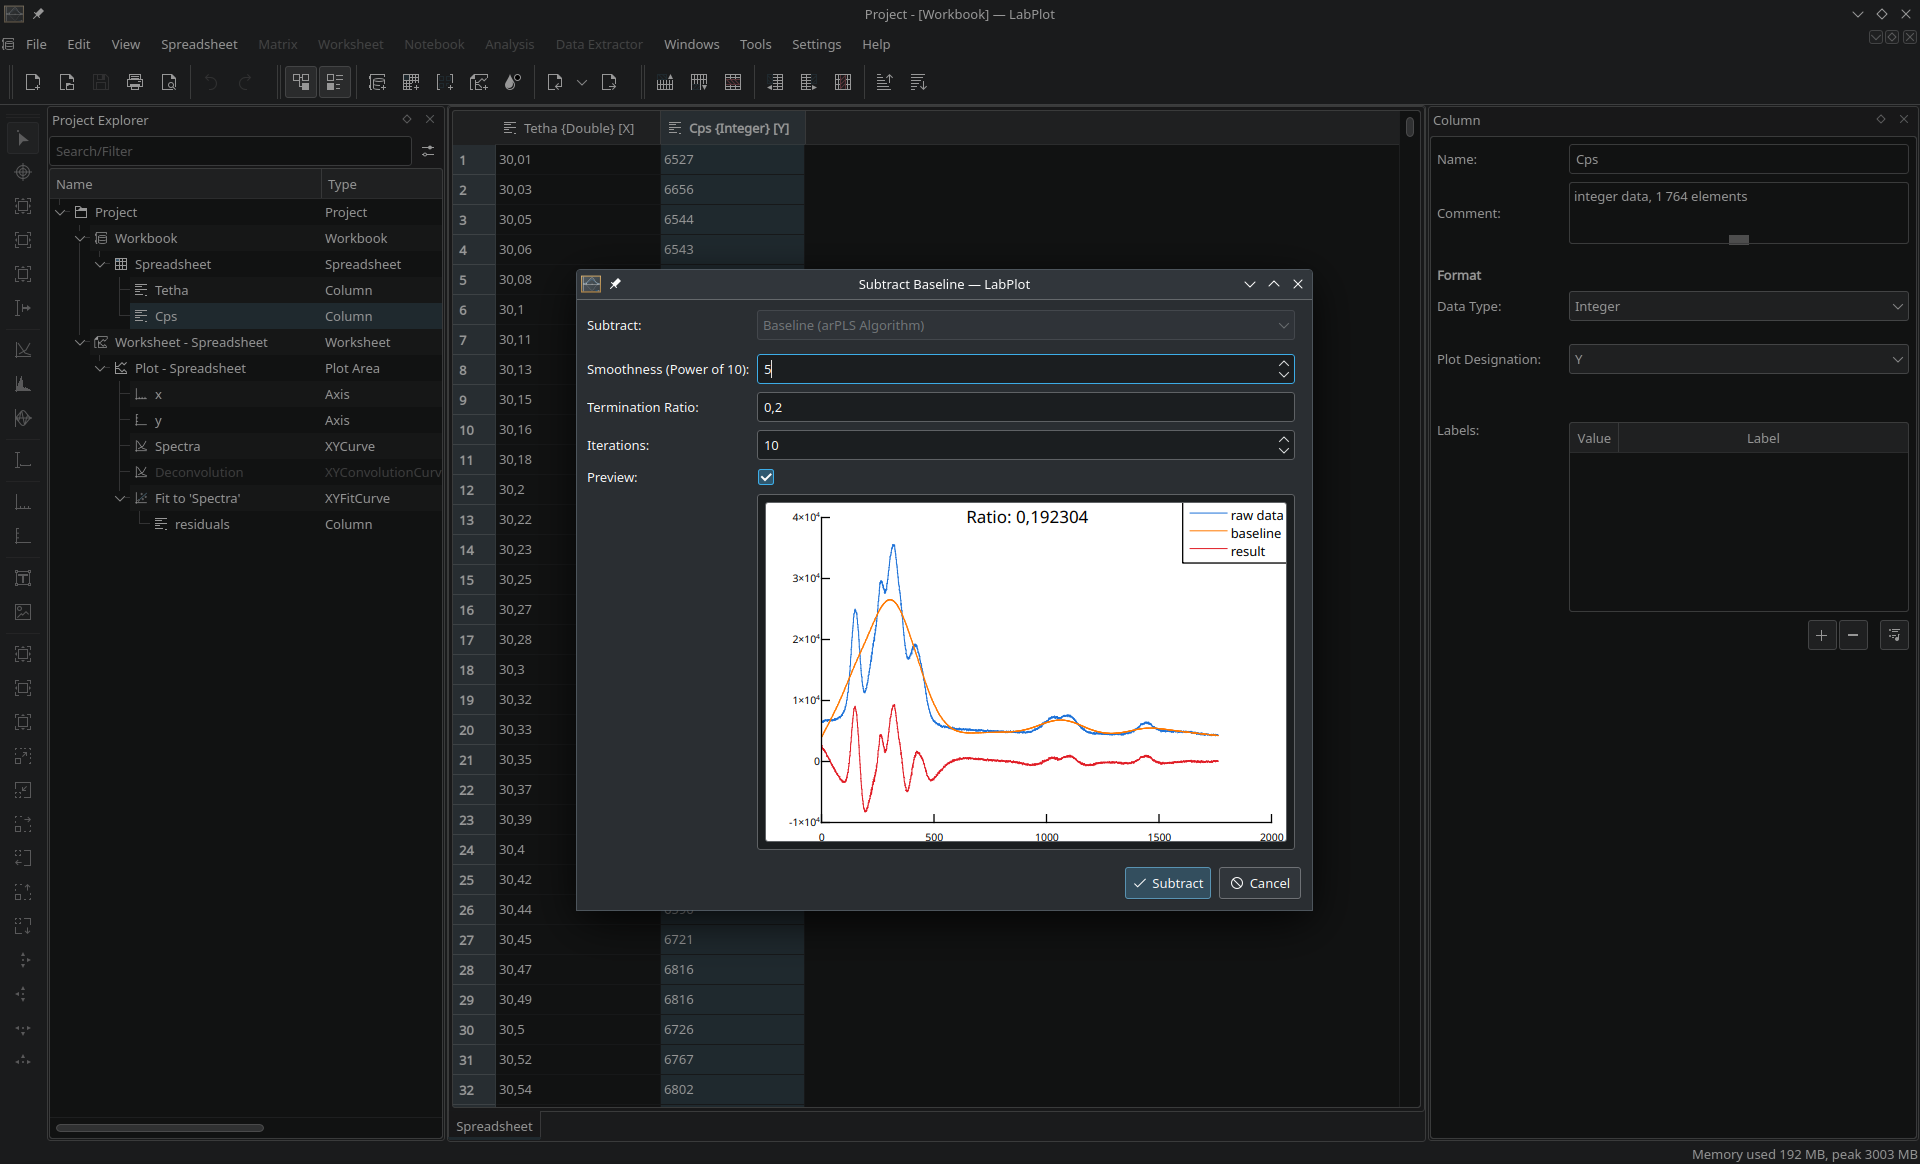
Baseline subtraction using the arPLS algorithm
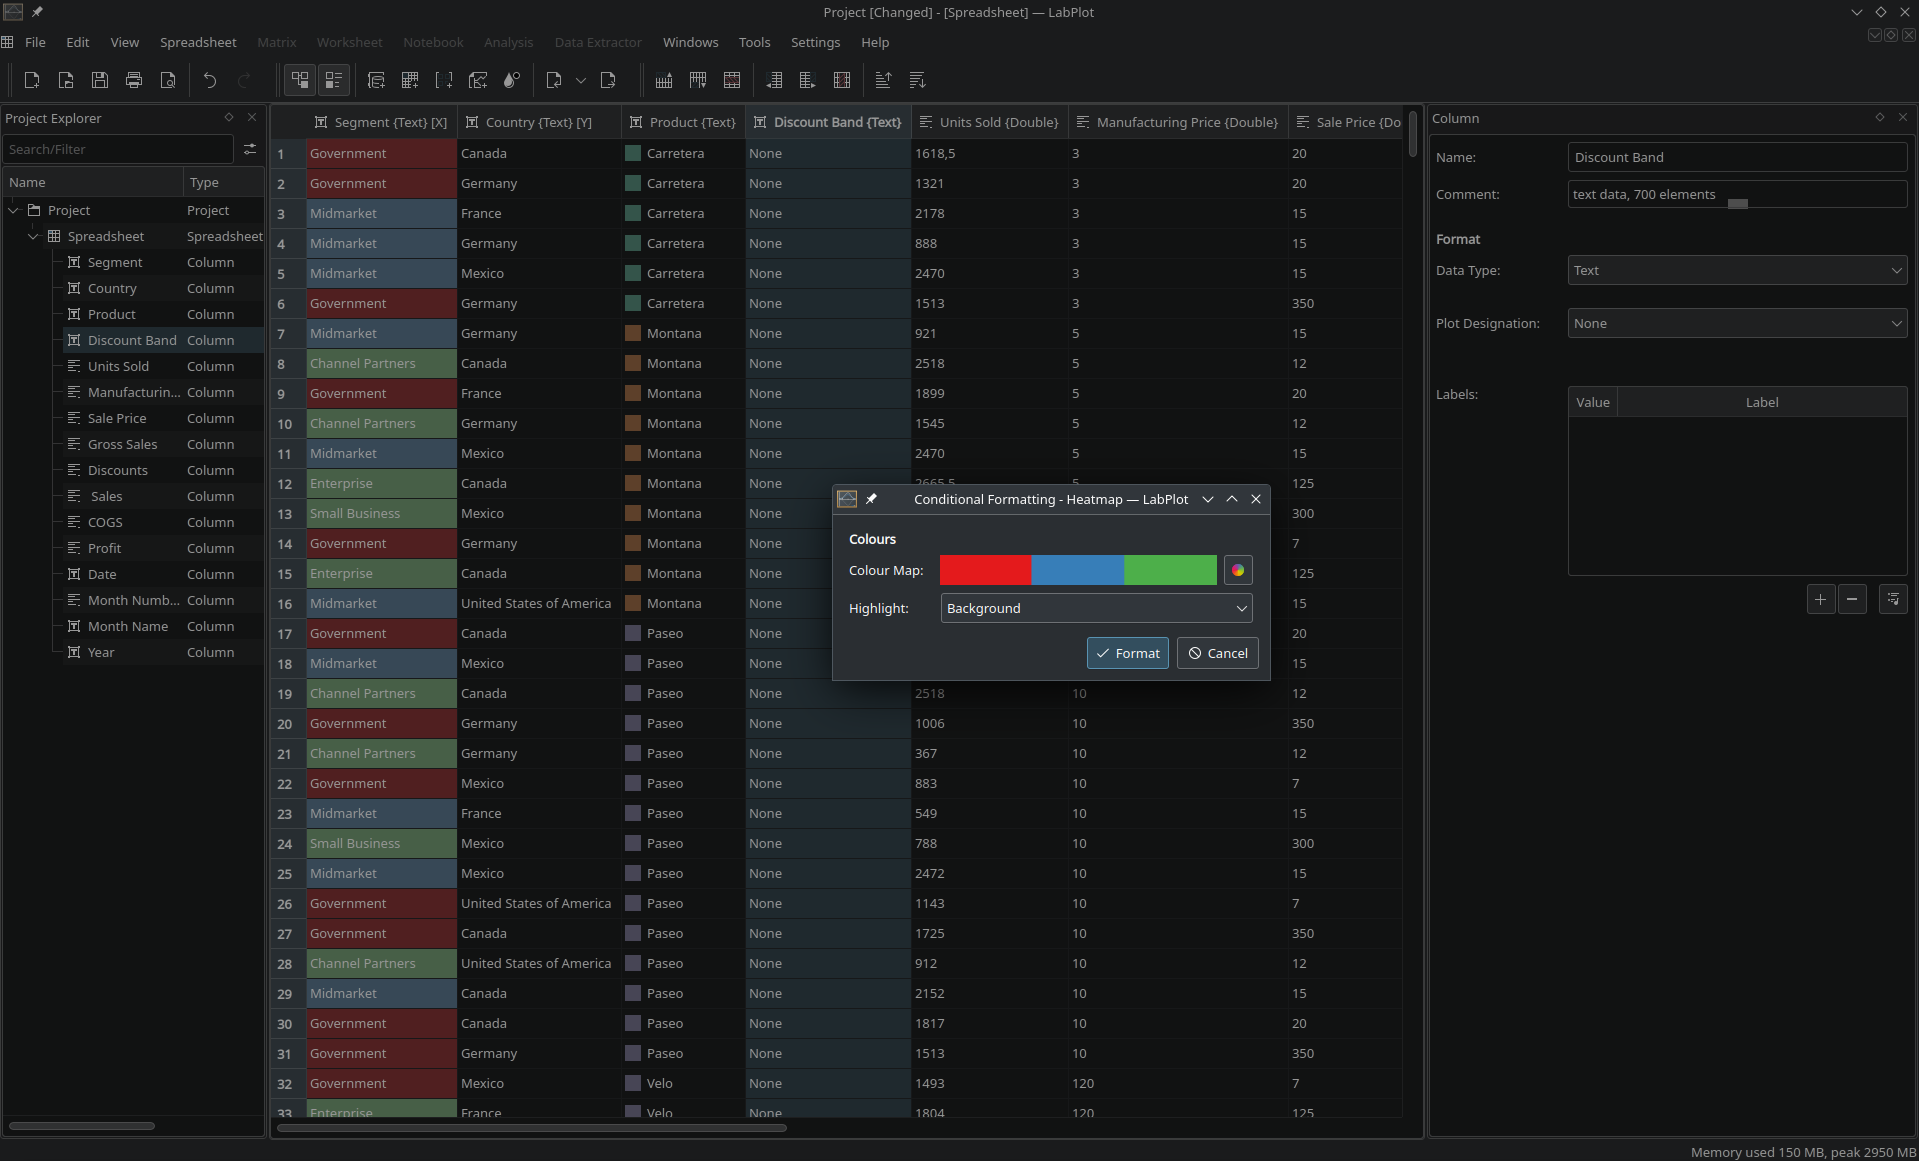
Heat-map formatting for categorical data in text columns
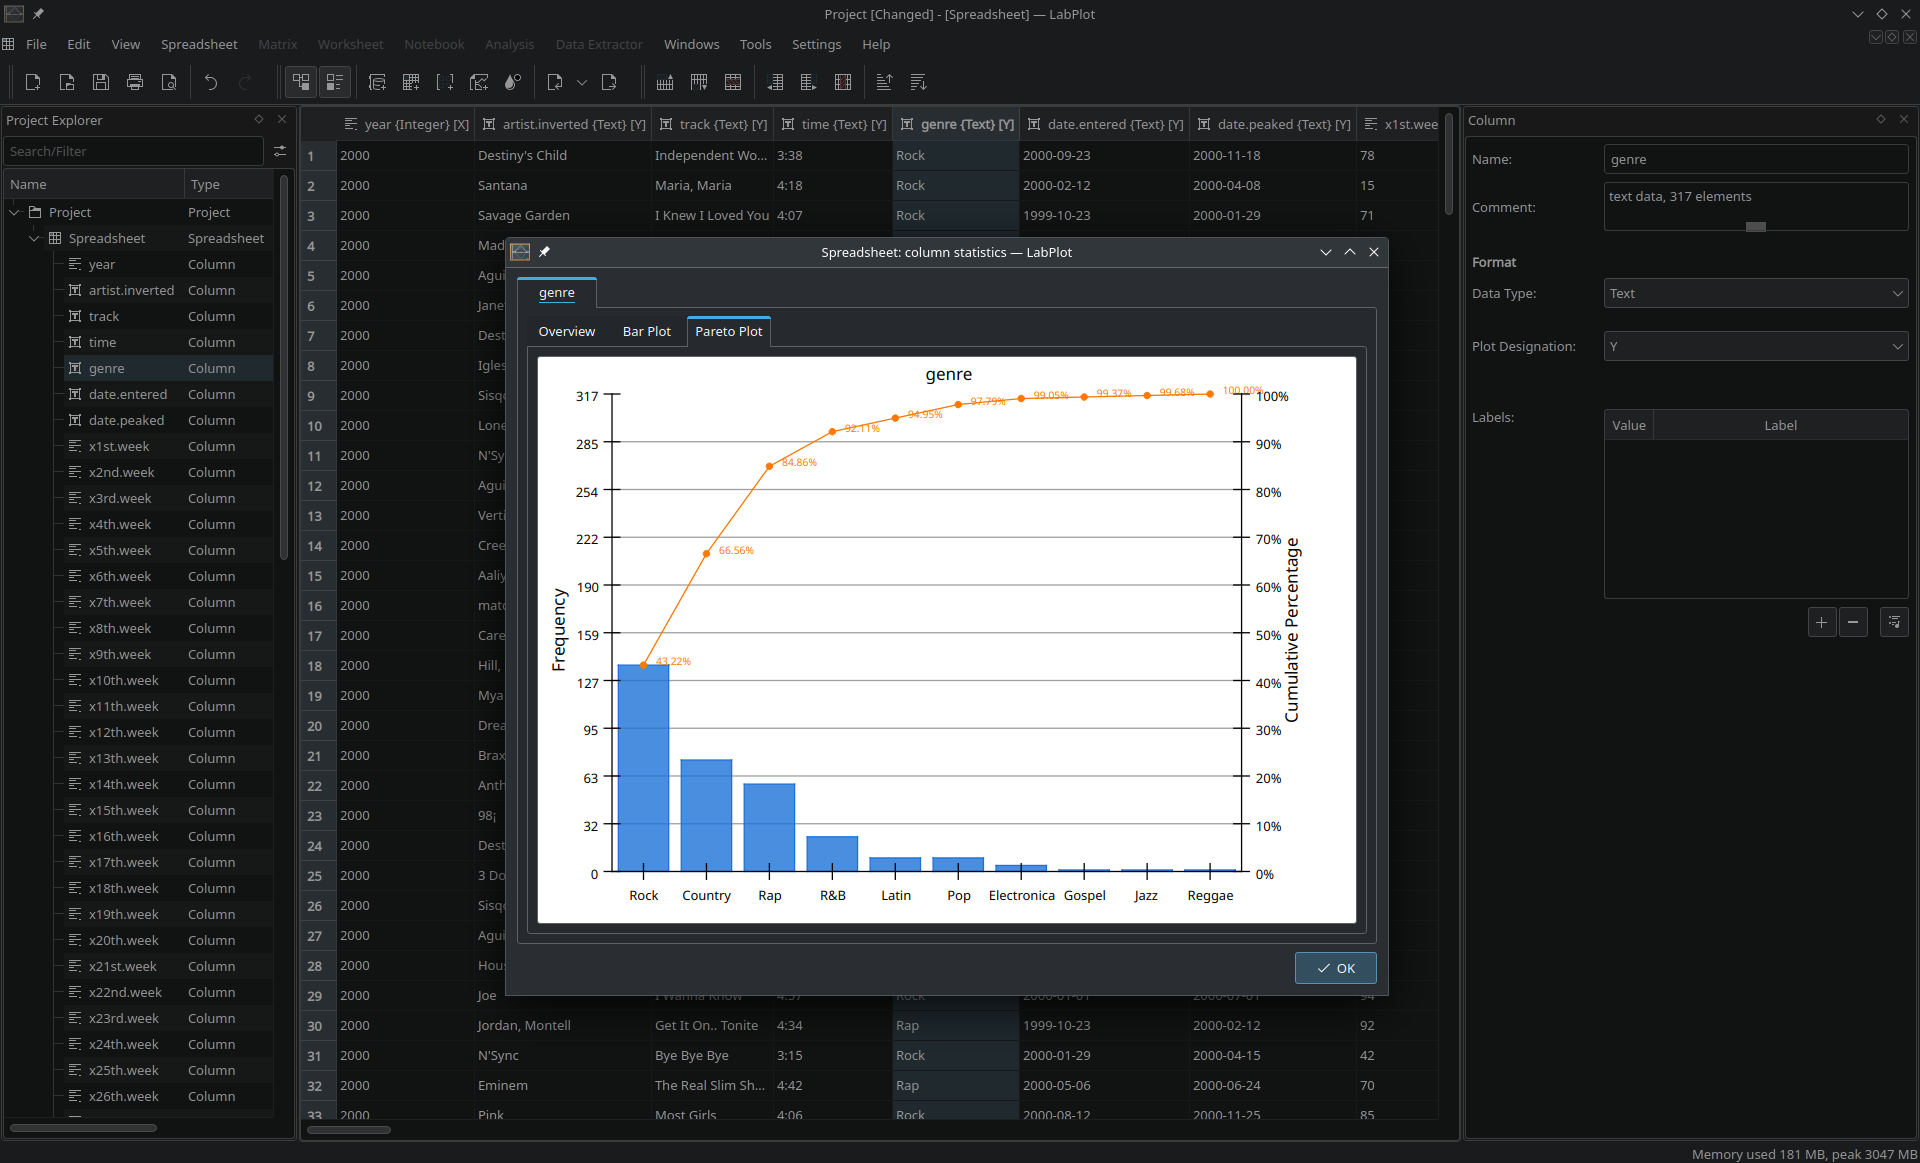
Column statistics for text columns, including the frequency table, bar and Pareto plots
Functions to access arbitrary cells of columns with cell (f(index), g(column, ..))
Functions to work with column statistics (size, mean, stddev, etc.)
Ability to specify the seed number when generating random numbers
Analysis
The new analysis tools added to LabPlot 2.10 include:
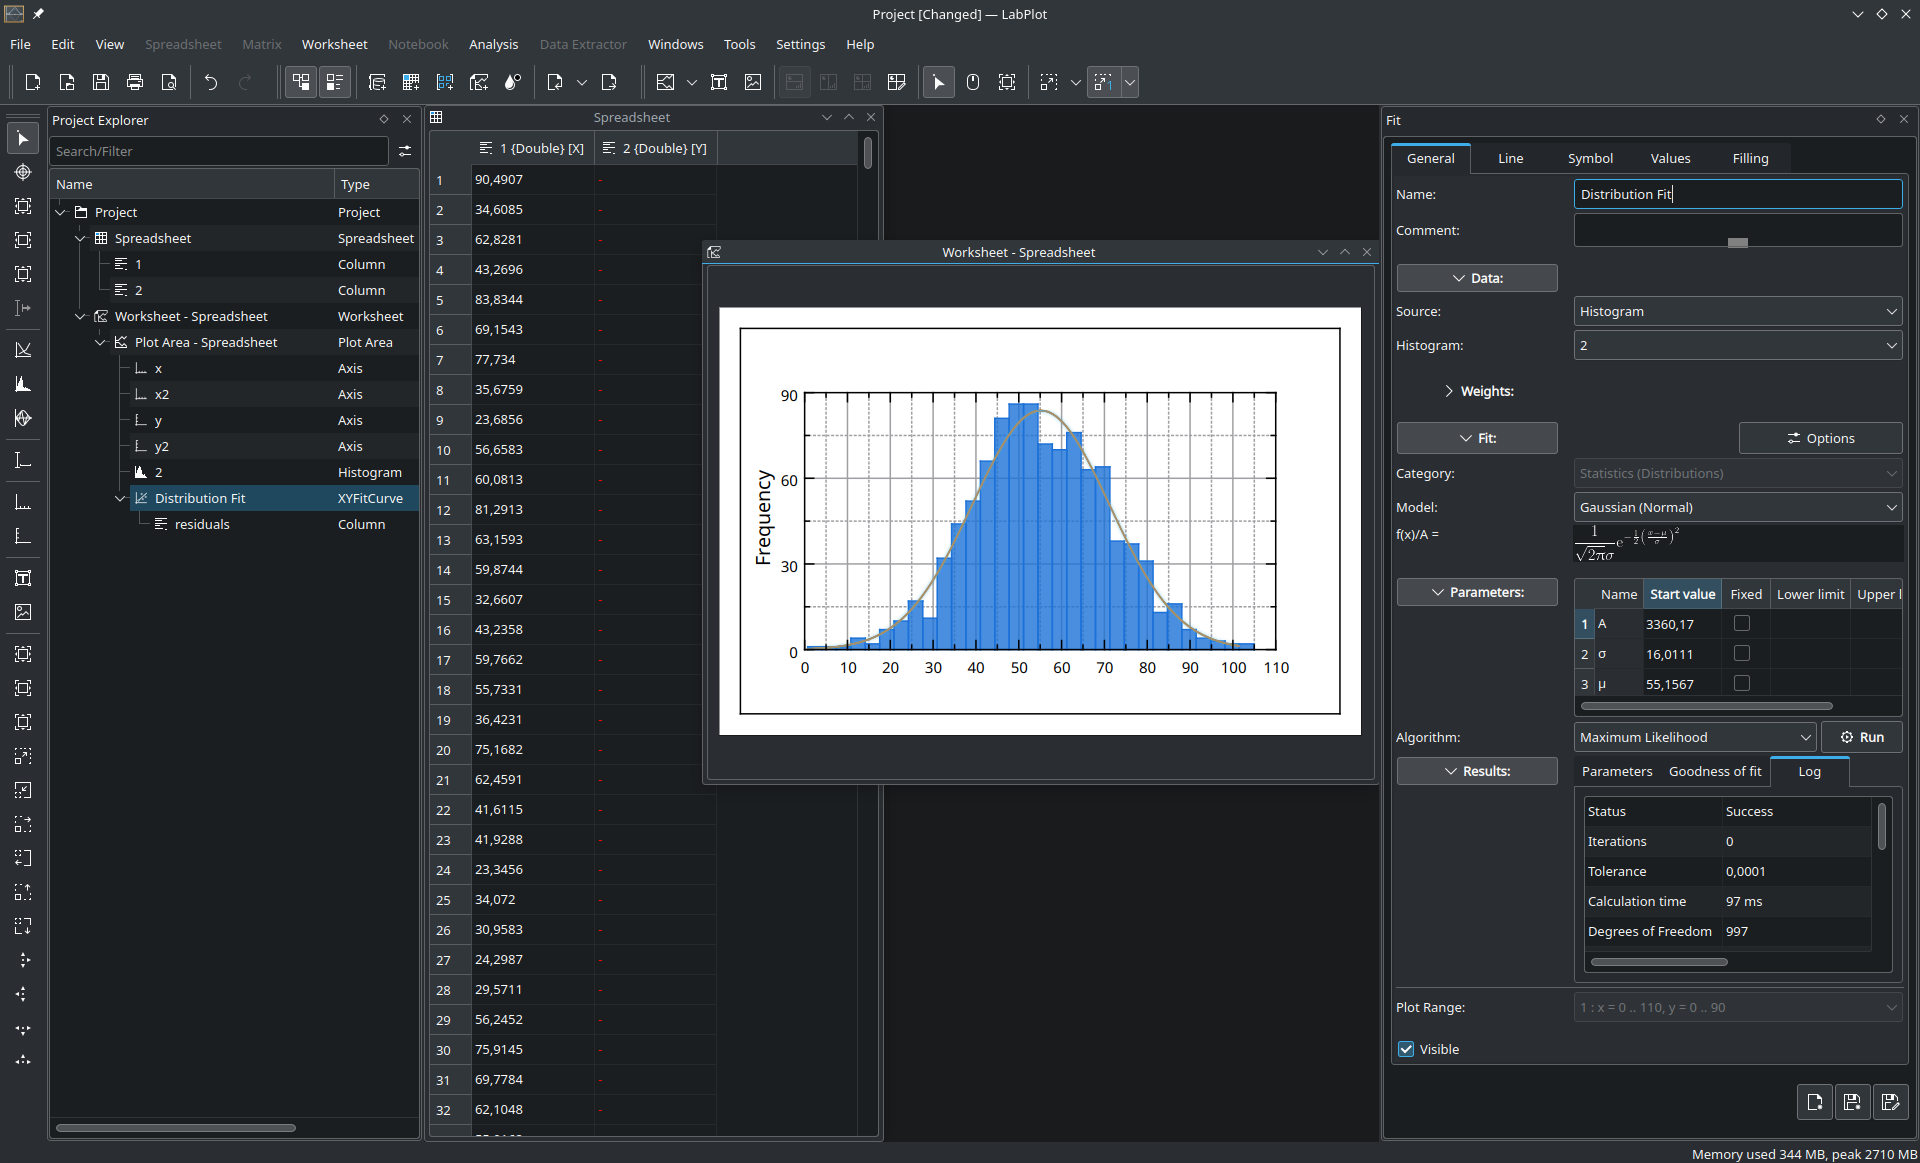
Maximum likelihood estimation for several distributions
Guess start values of fit parameter for polynomial models by linear regression
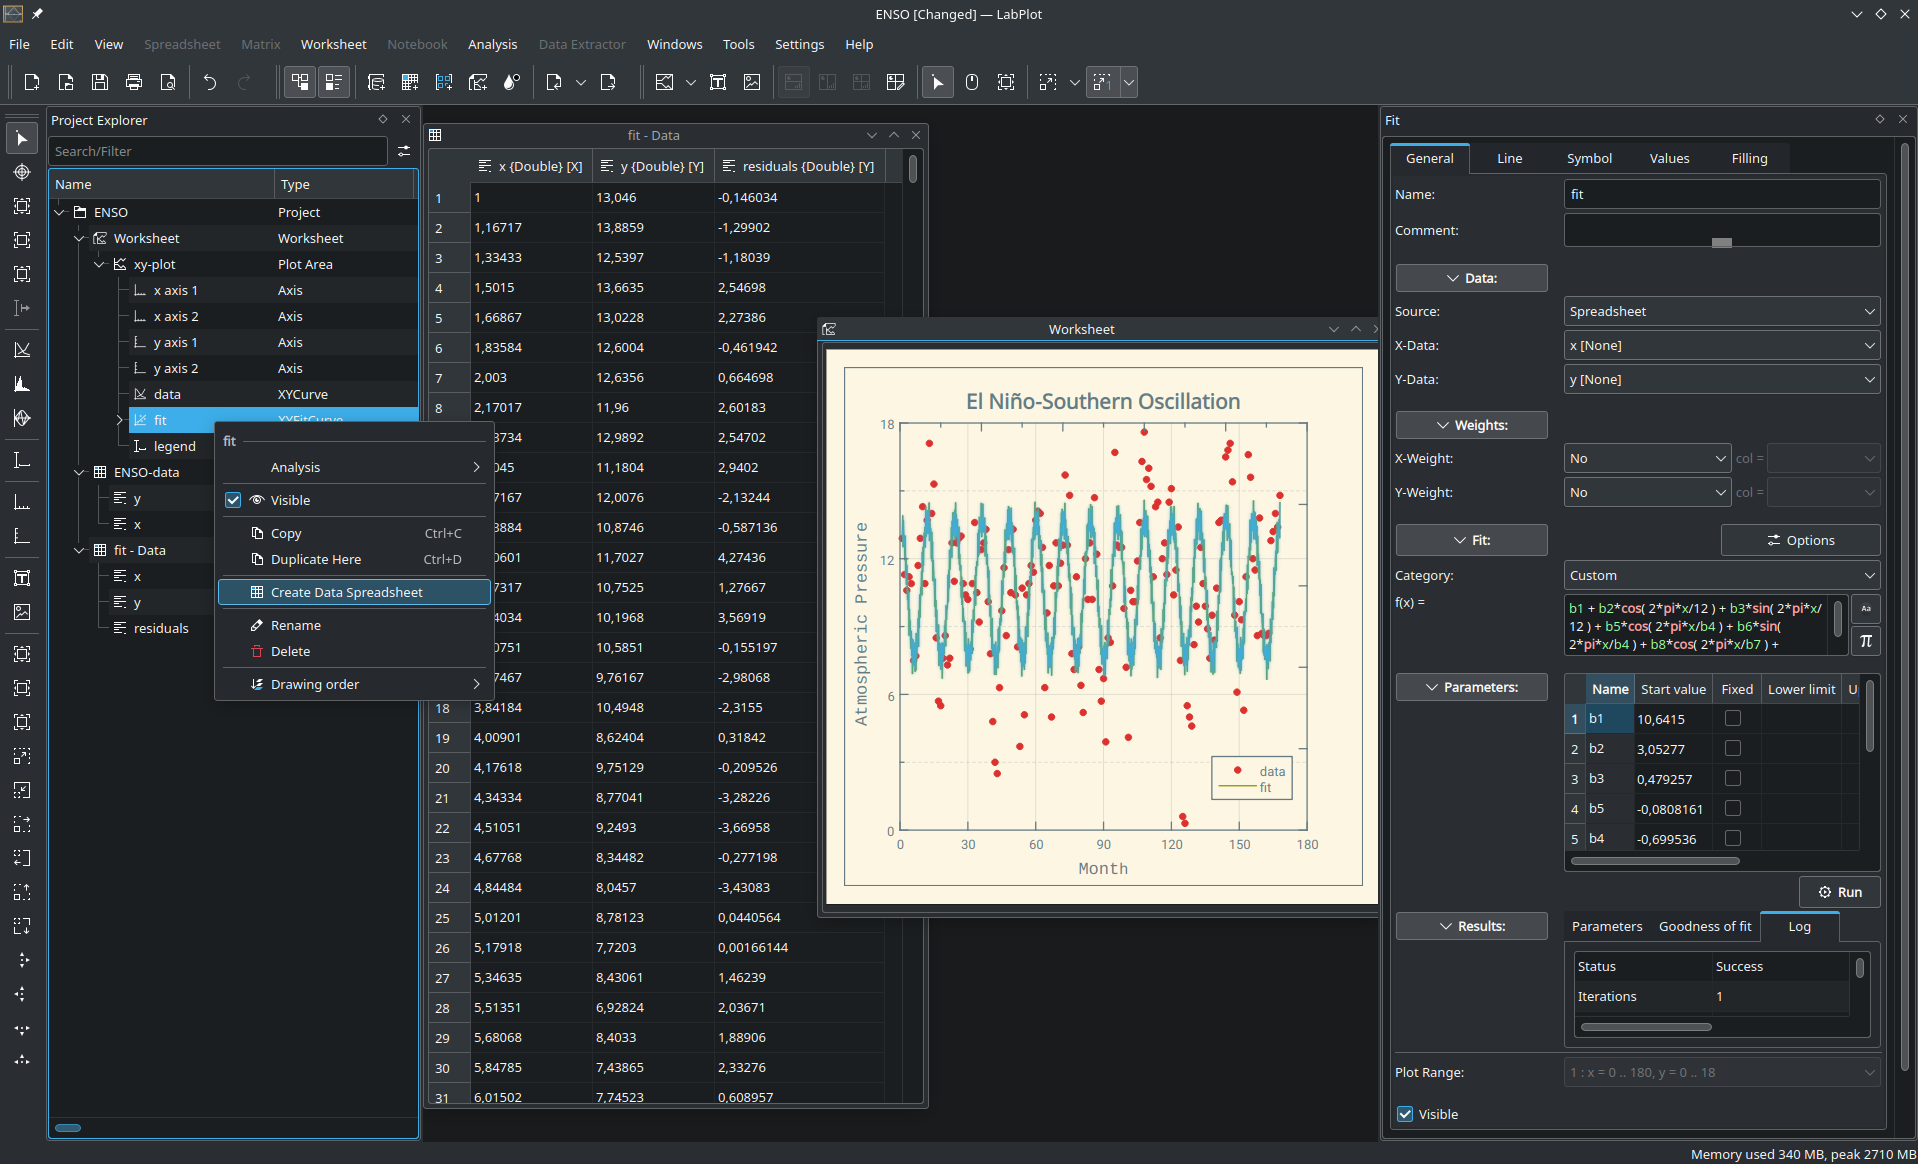
Export the results of a computation to a new spreadsheet
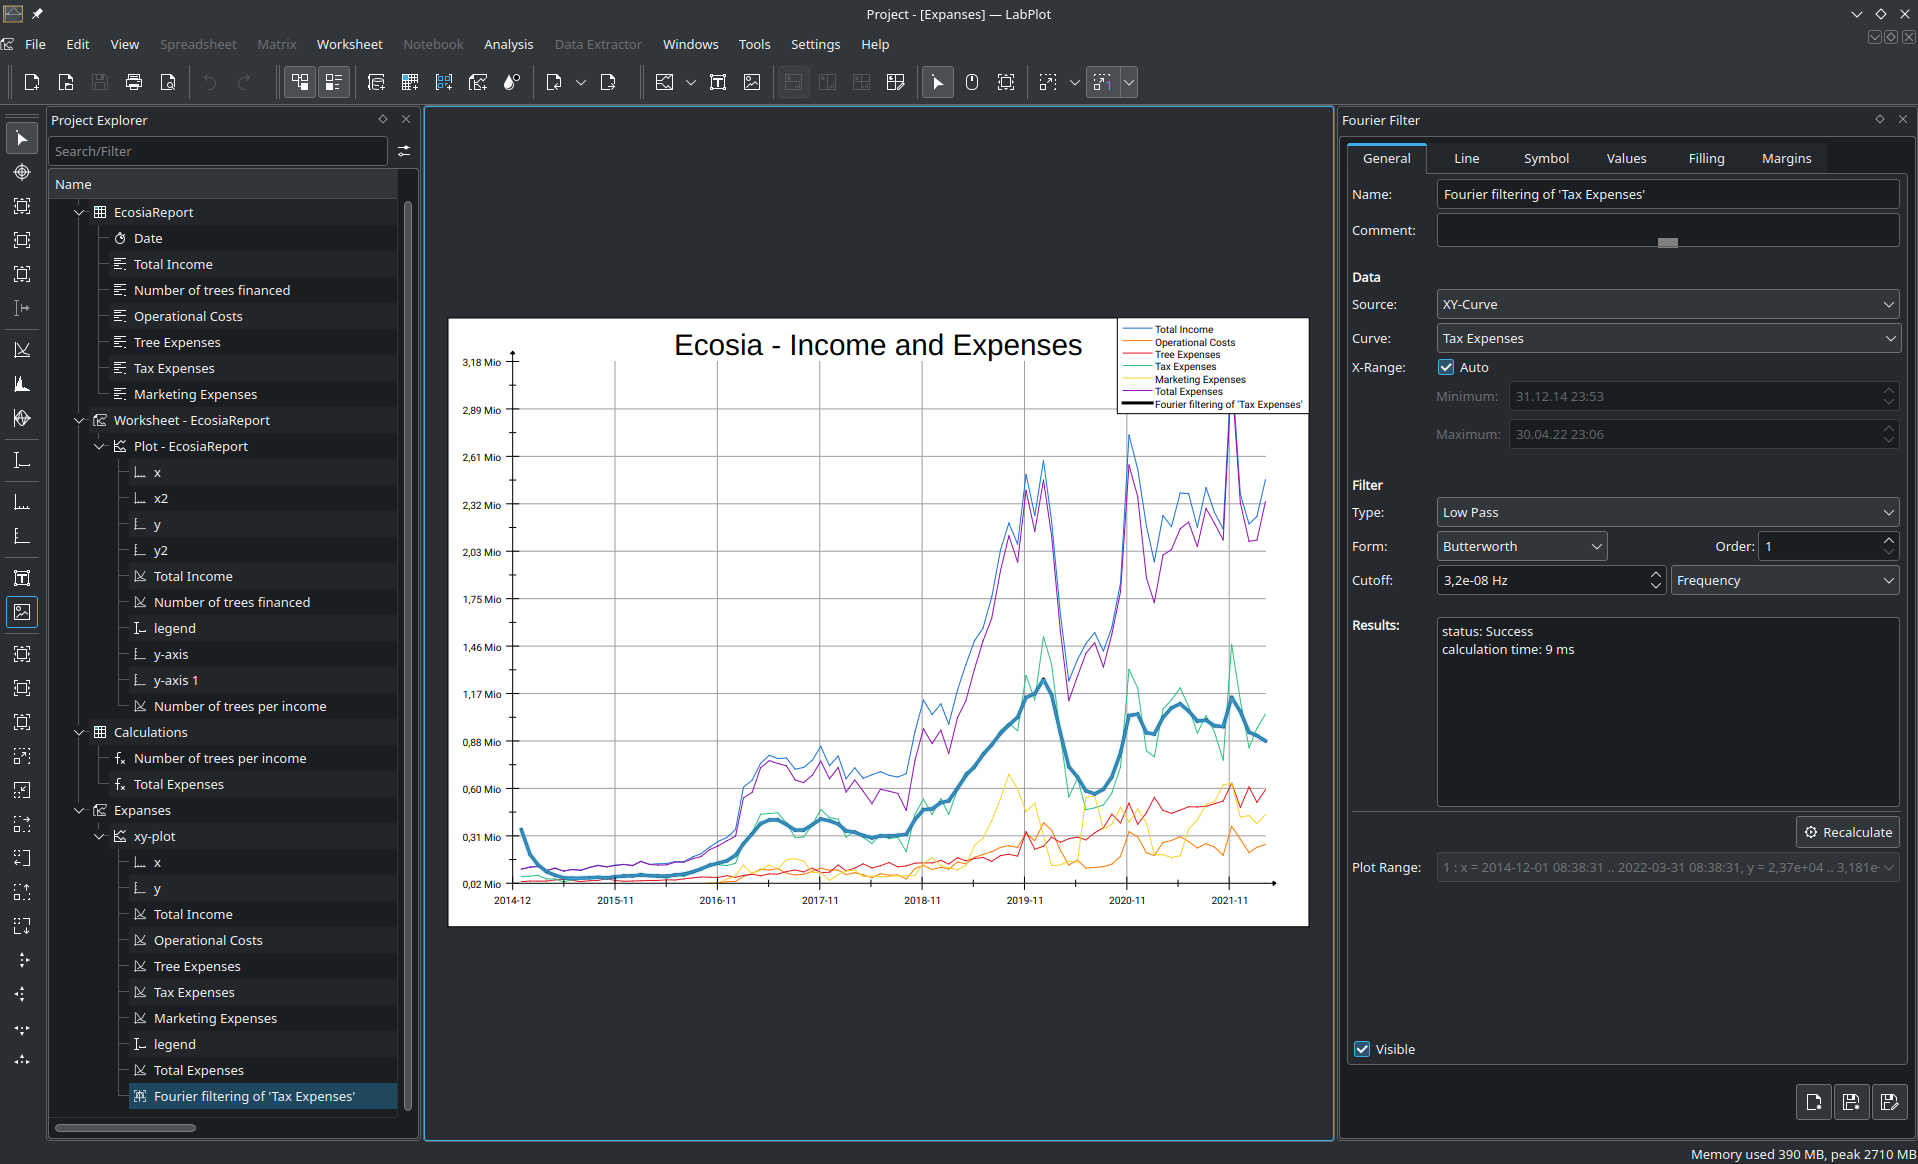
Fourier filtering for DateTime data
Import/Export
LabPlot 2.10 adds support for new file formats and multiple optimizations to improve import performance:
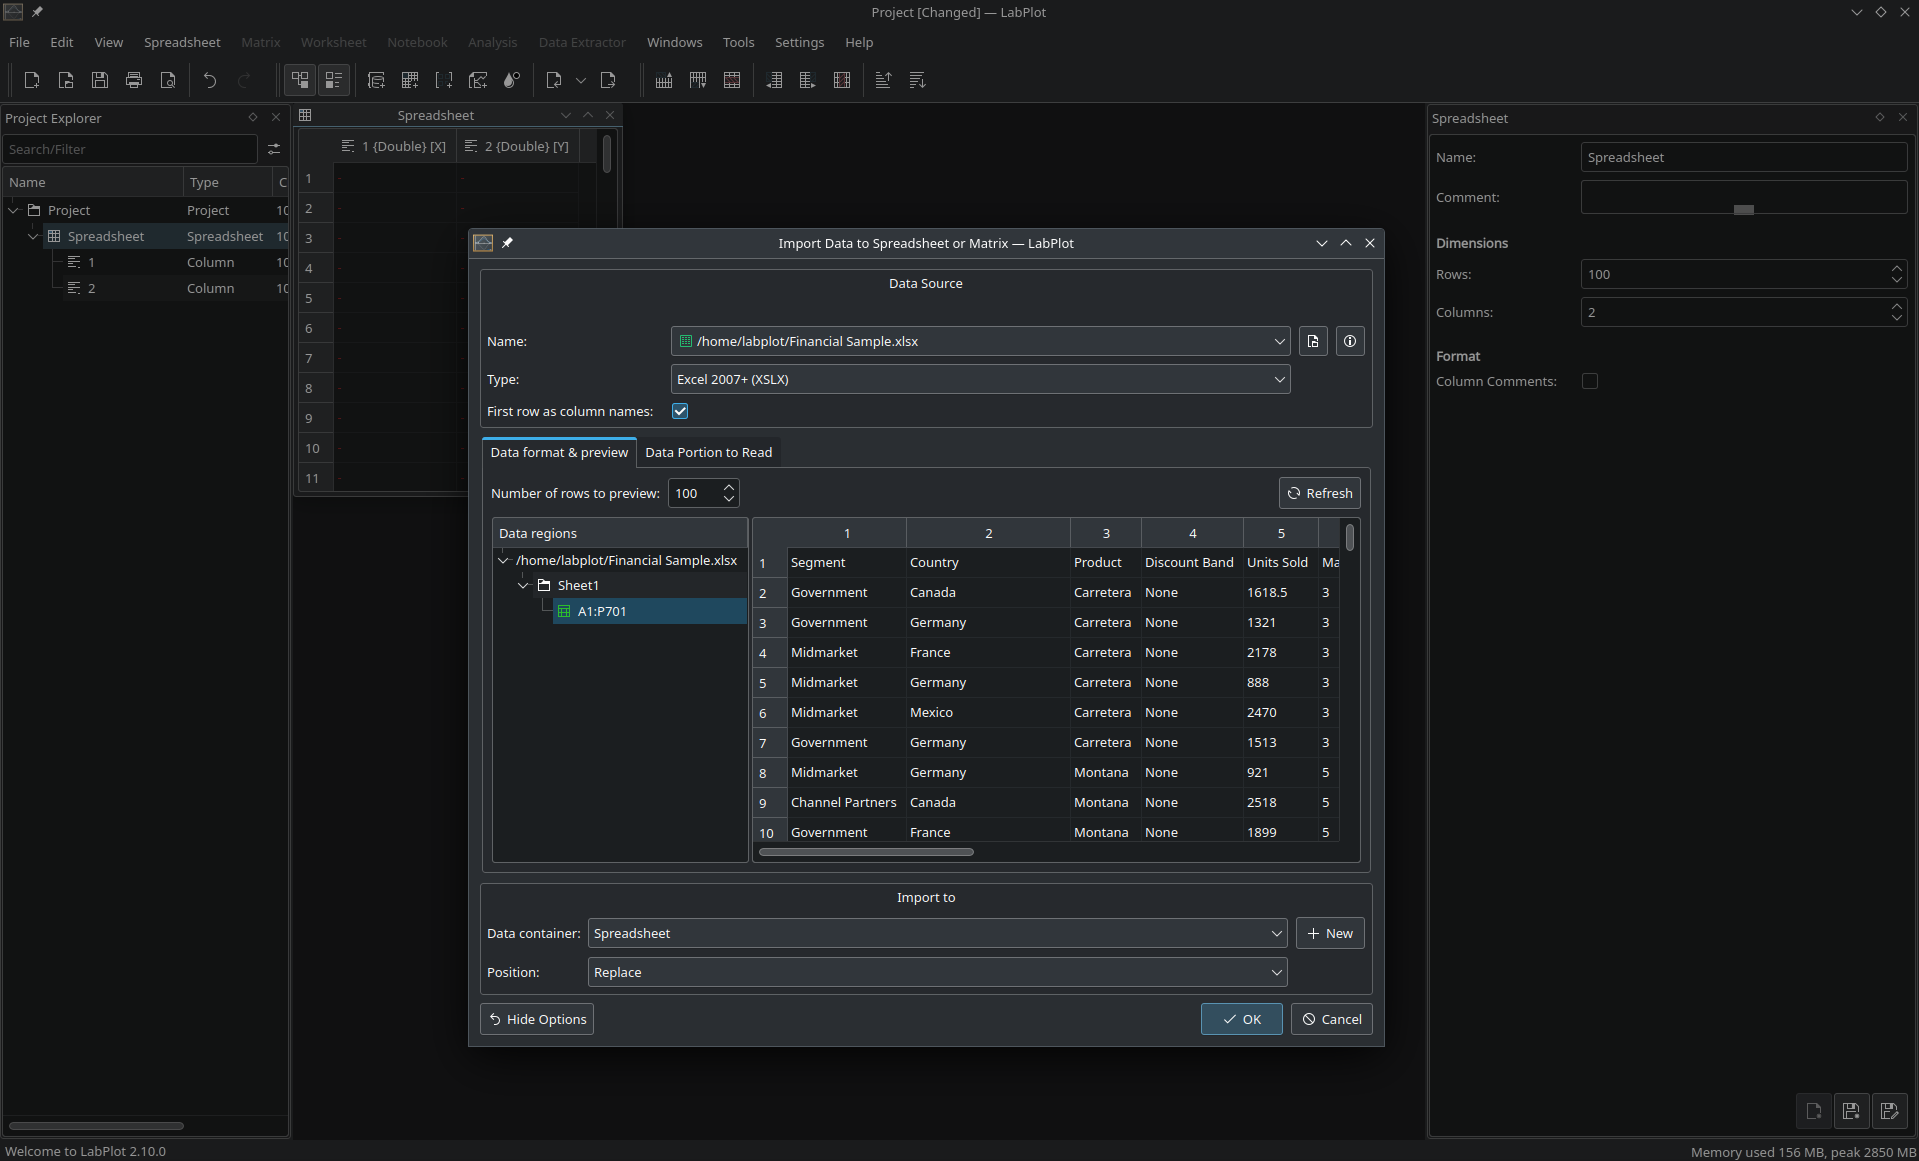
Import of Excel .xlsx files
Export spreadsheet and matrices to Excel .xlsx format
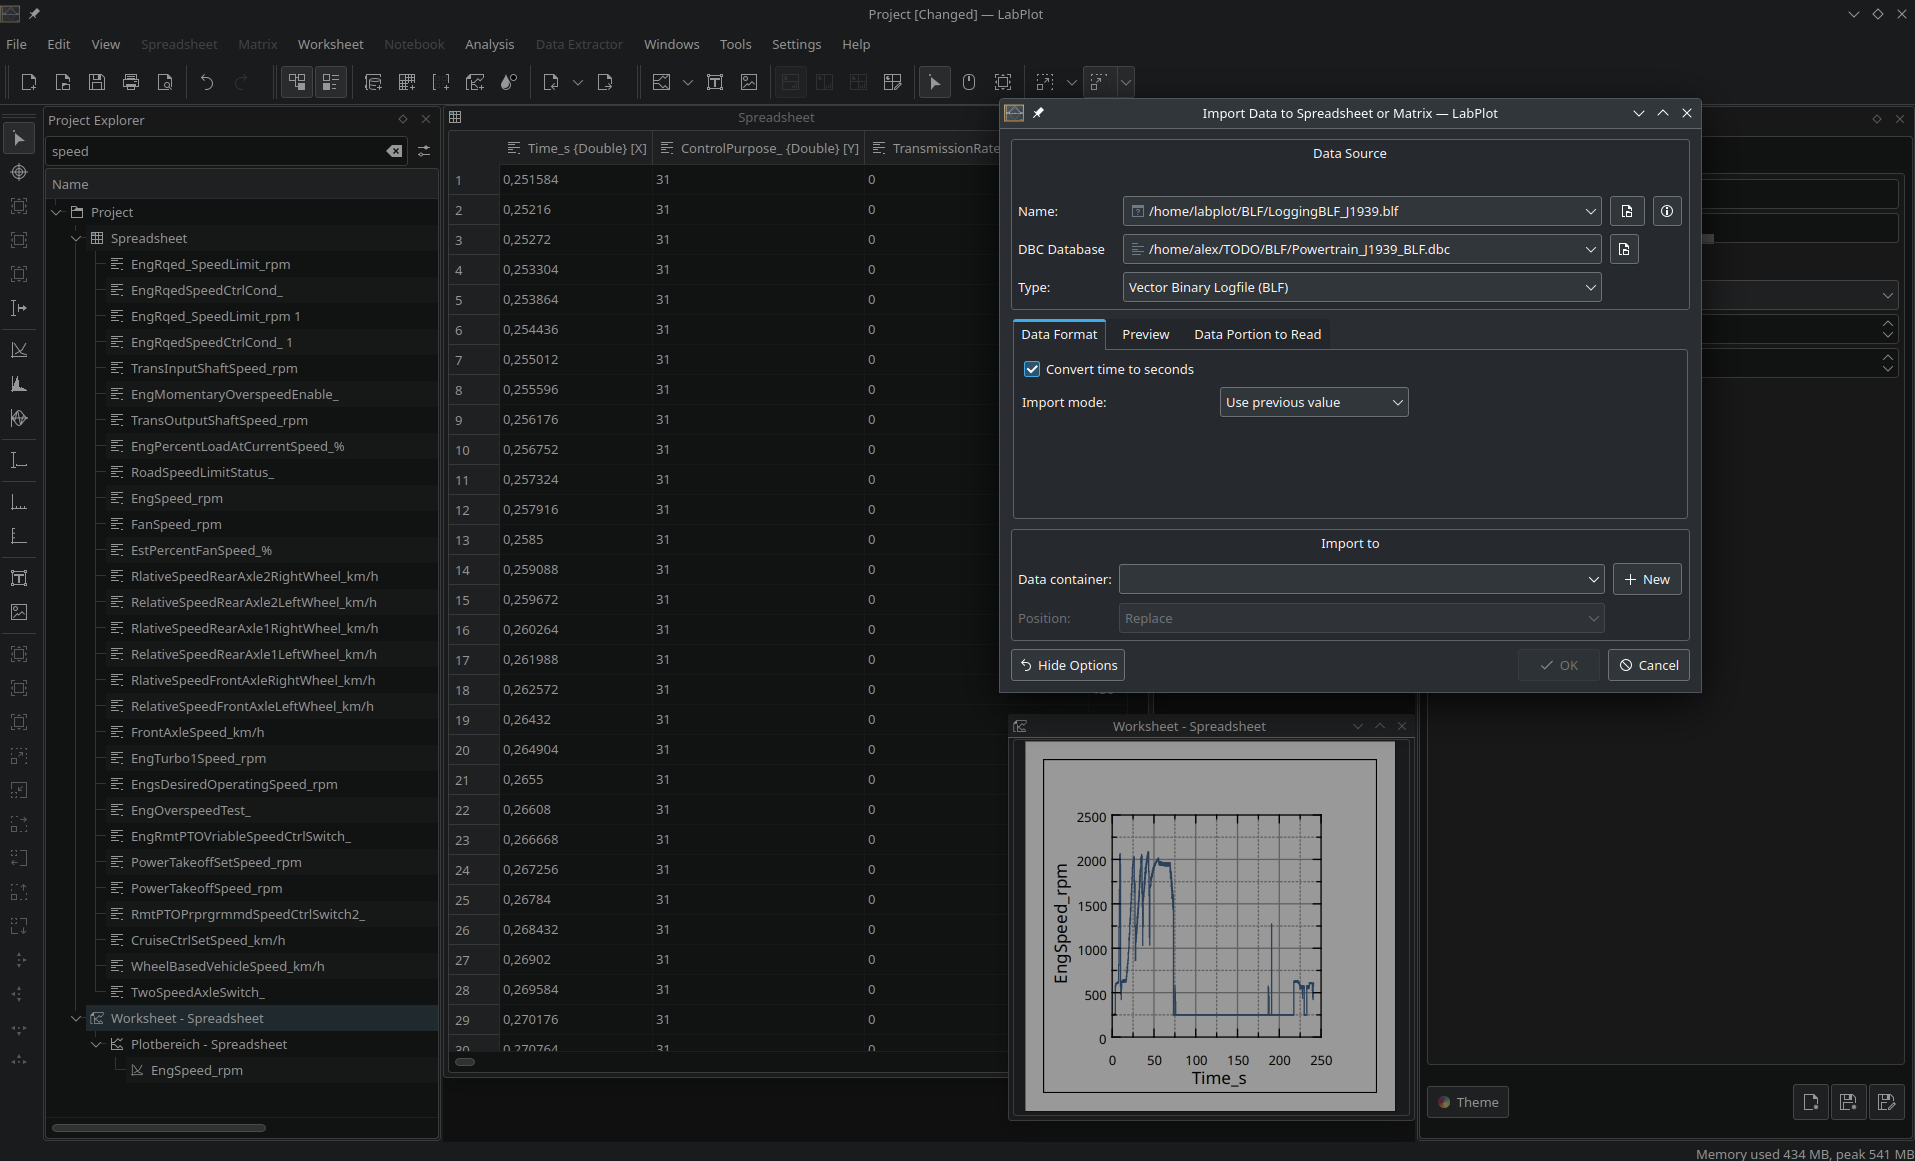
Import of Binary Log File (BLF) files from Vektor Informatik
HDF5: support VLEN data import
Reduced memory consumption when importing from a database table into a spreadsheet
Reduced memory consumption during the spreadsheet export to SQLite databases
Faster import of files with a large number of columns
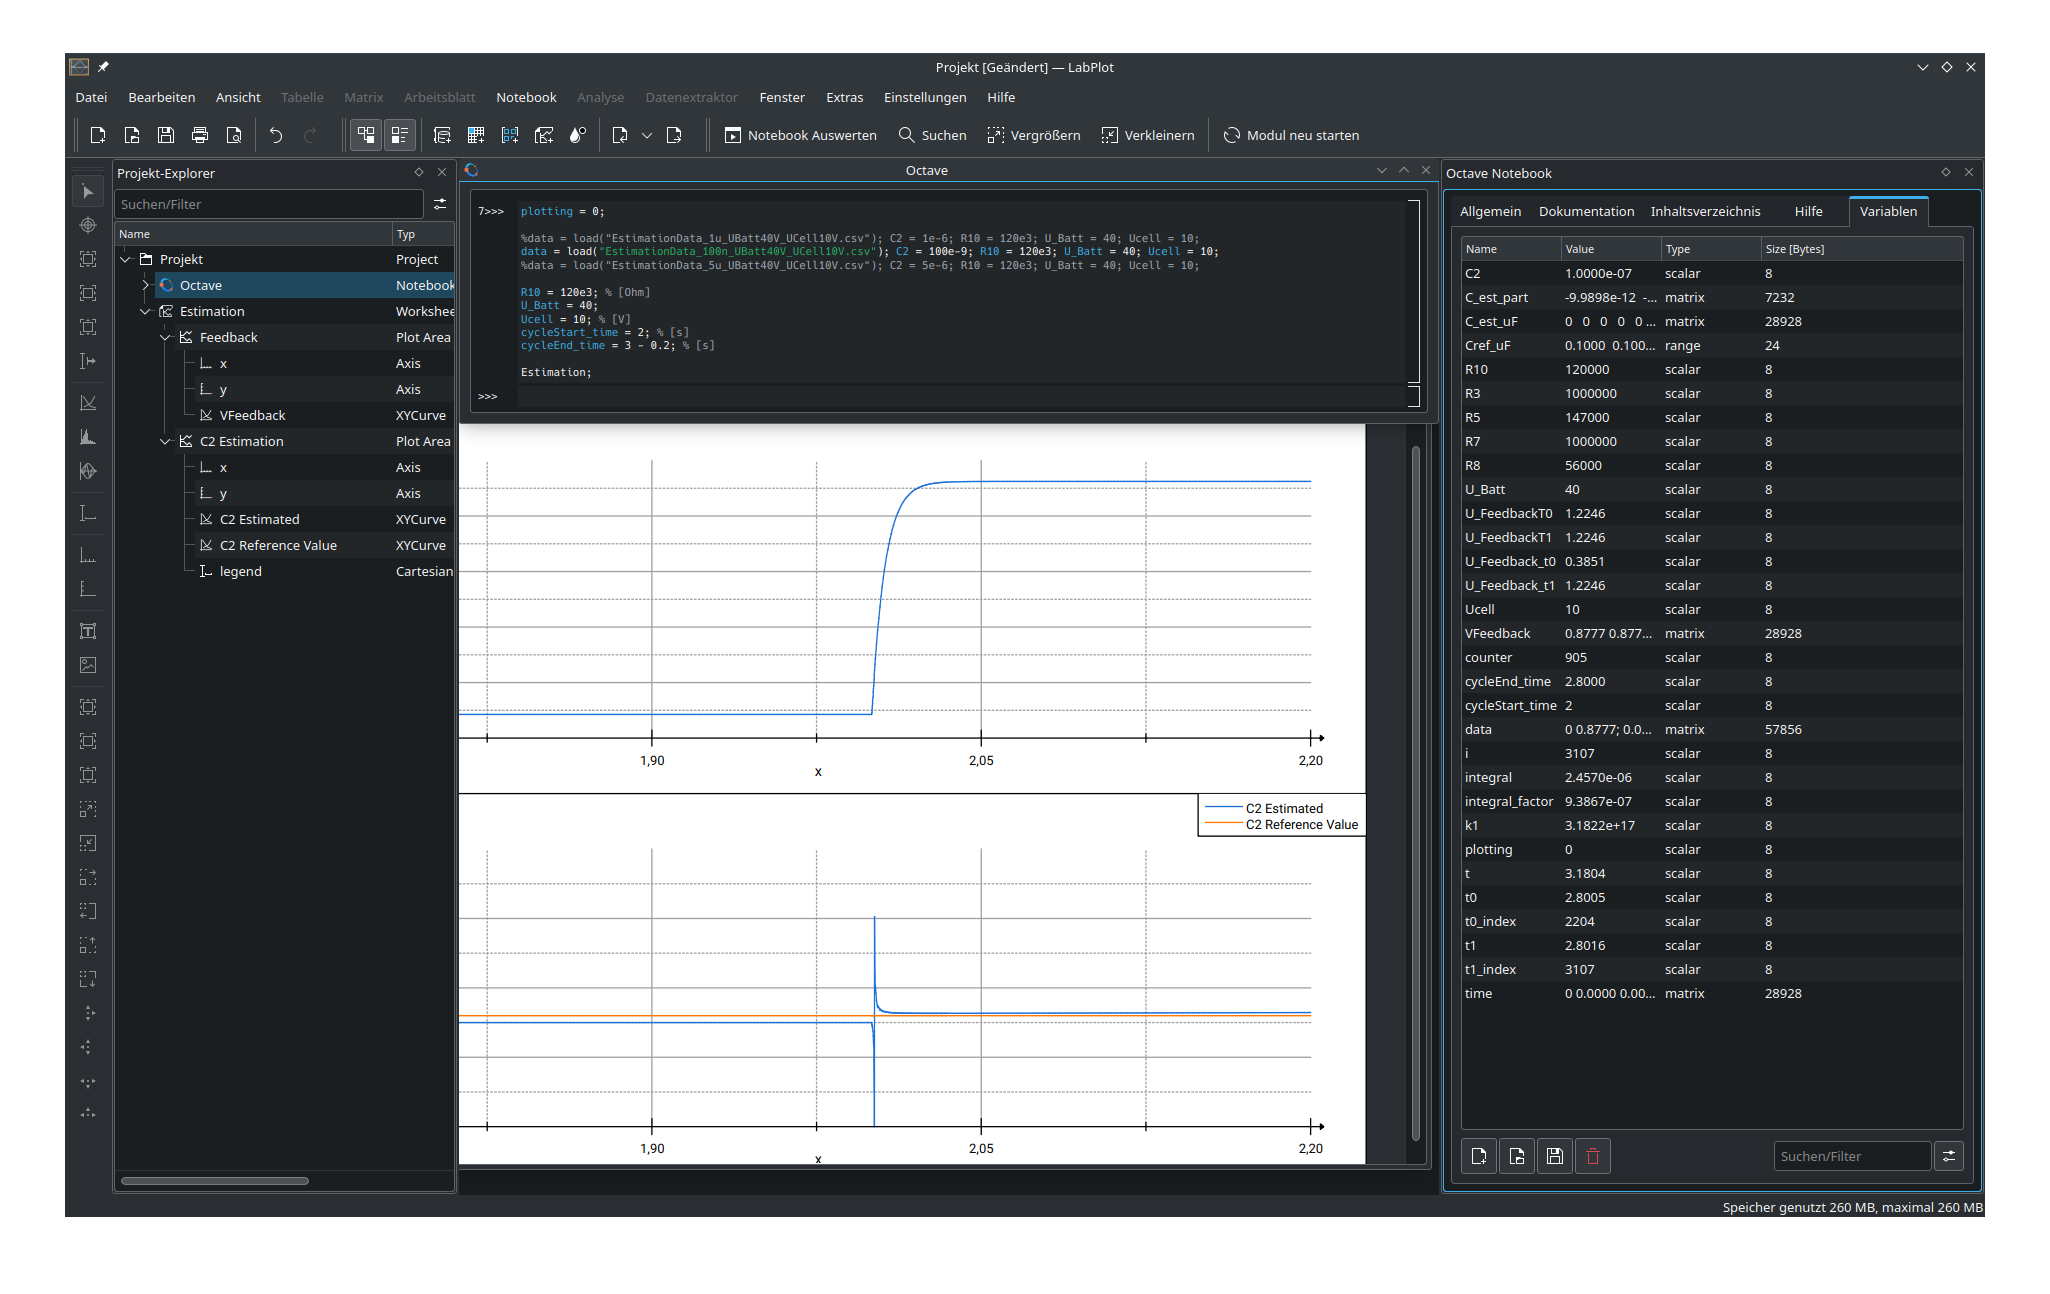
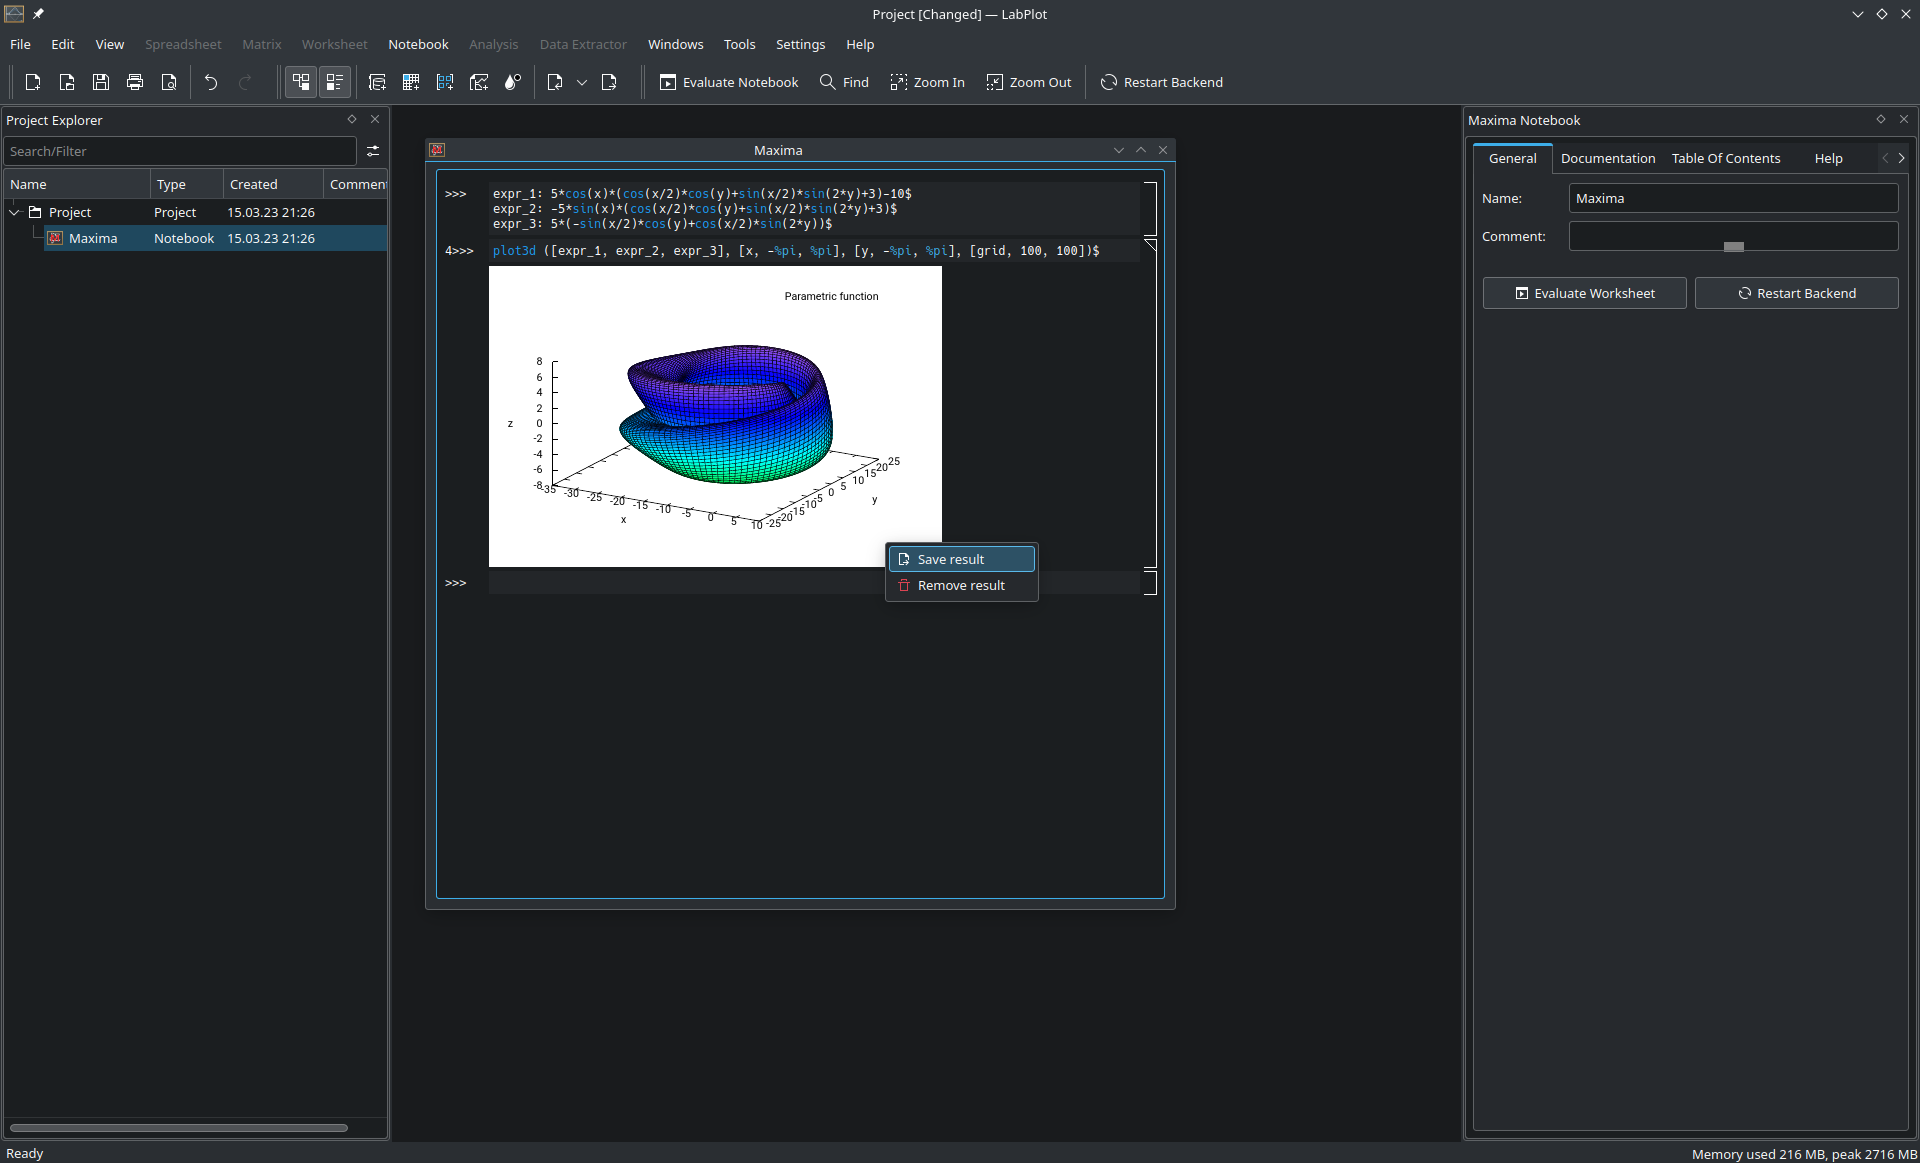
Notebook
The 2.10 release Improves the variable panel and plot export:
Show the type of a variable, its size (in Bytes), and its dimension (number of rows and columns) for backends that provide this information
Properly show the values of Octave’s row vectors and matrices
Allow to copy variable names and values to the clipboard
Export plot results to vector graphic formats (PDF and SVG)