Gallery
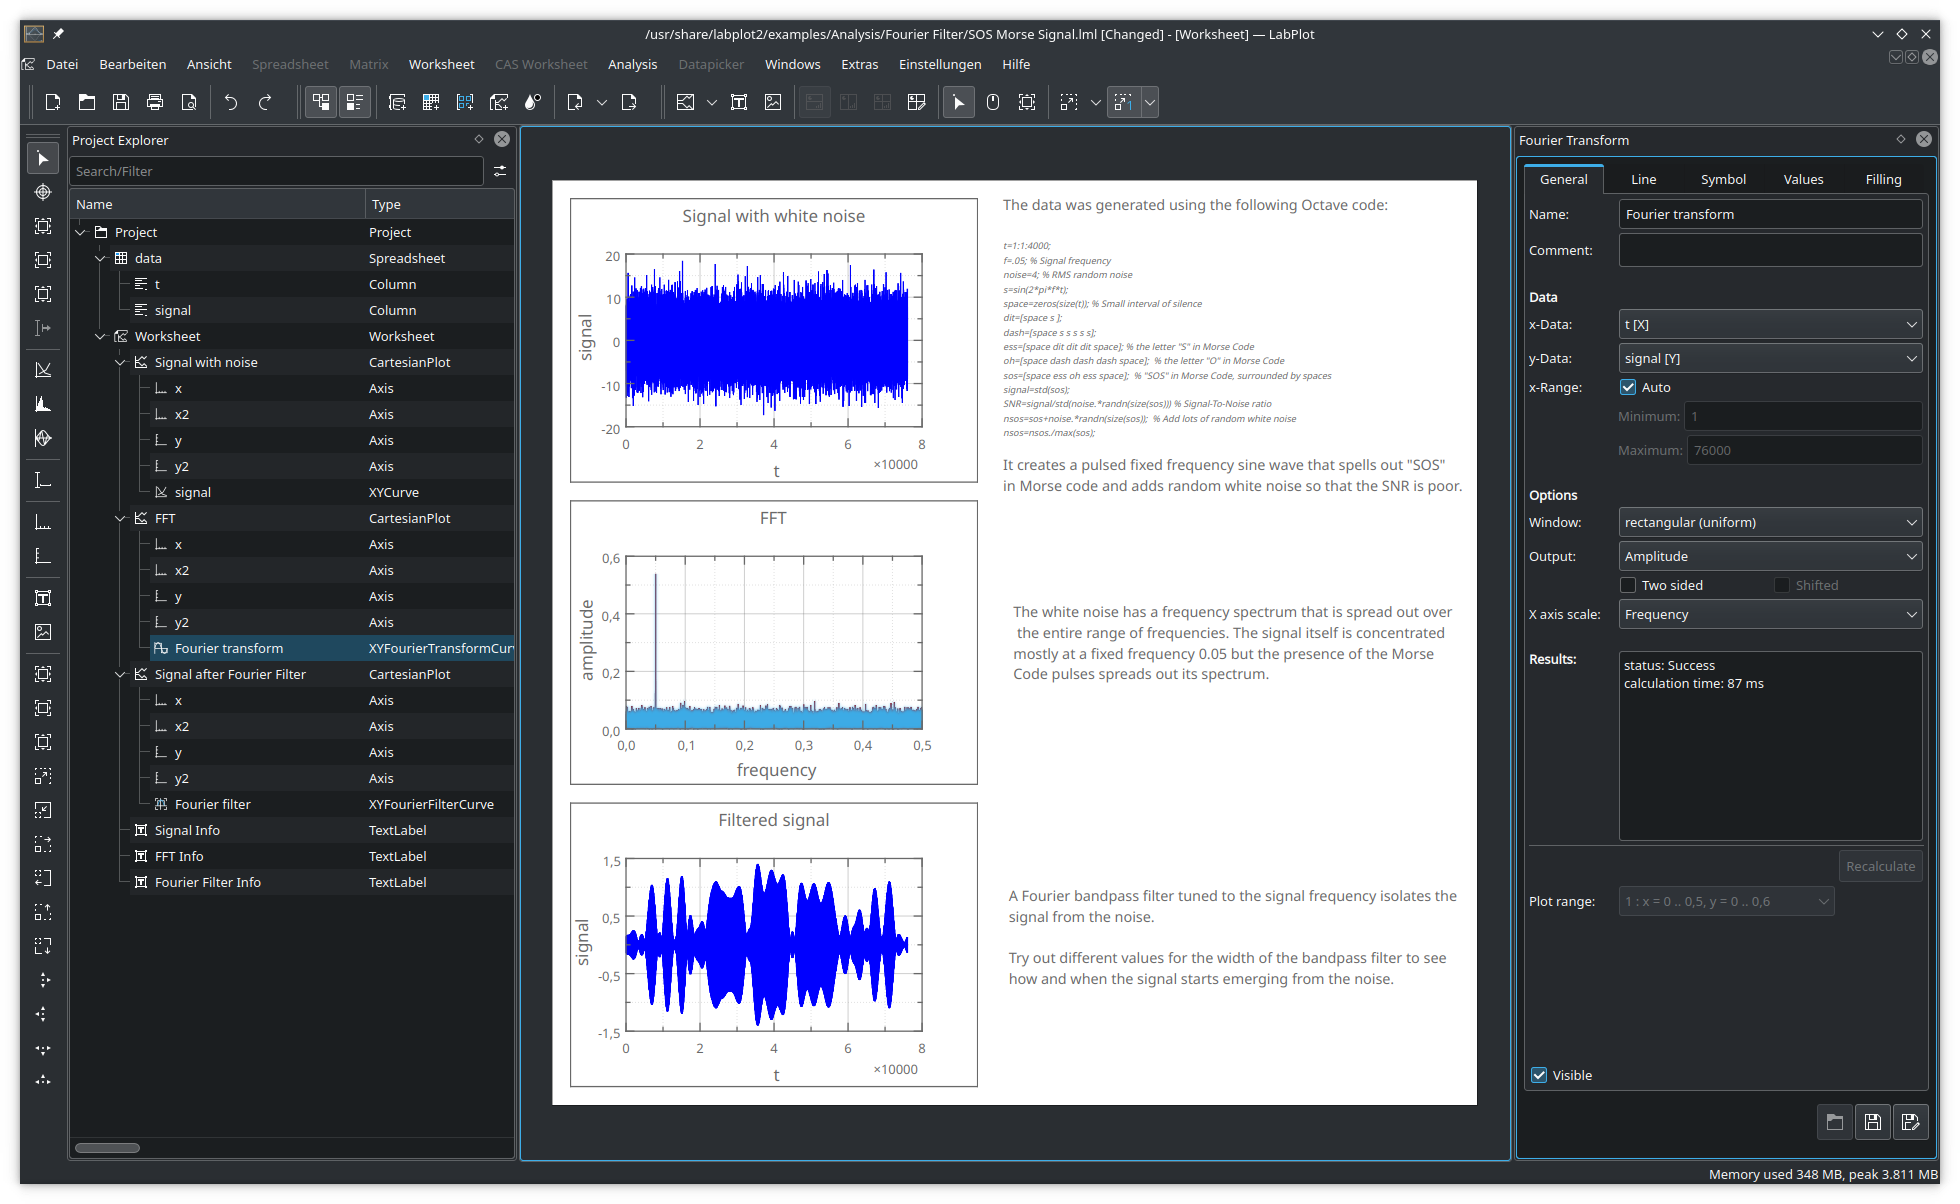
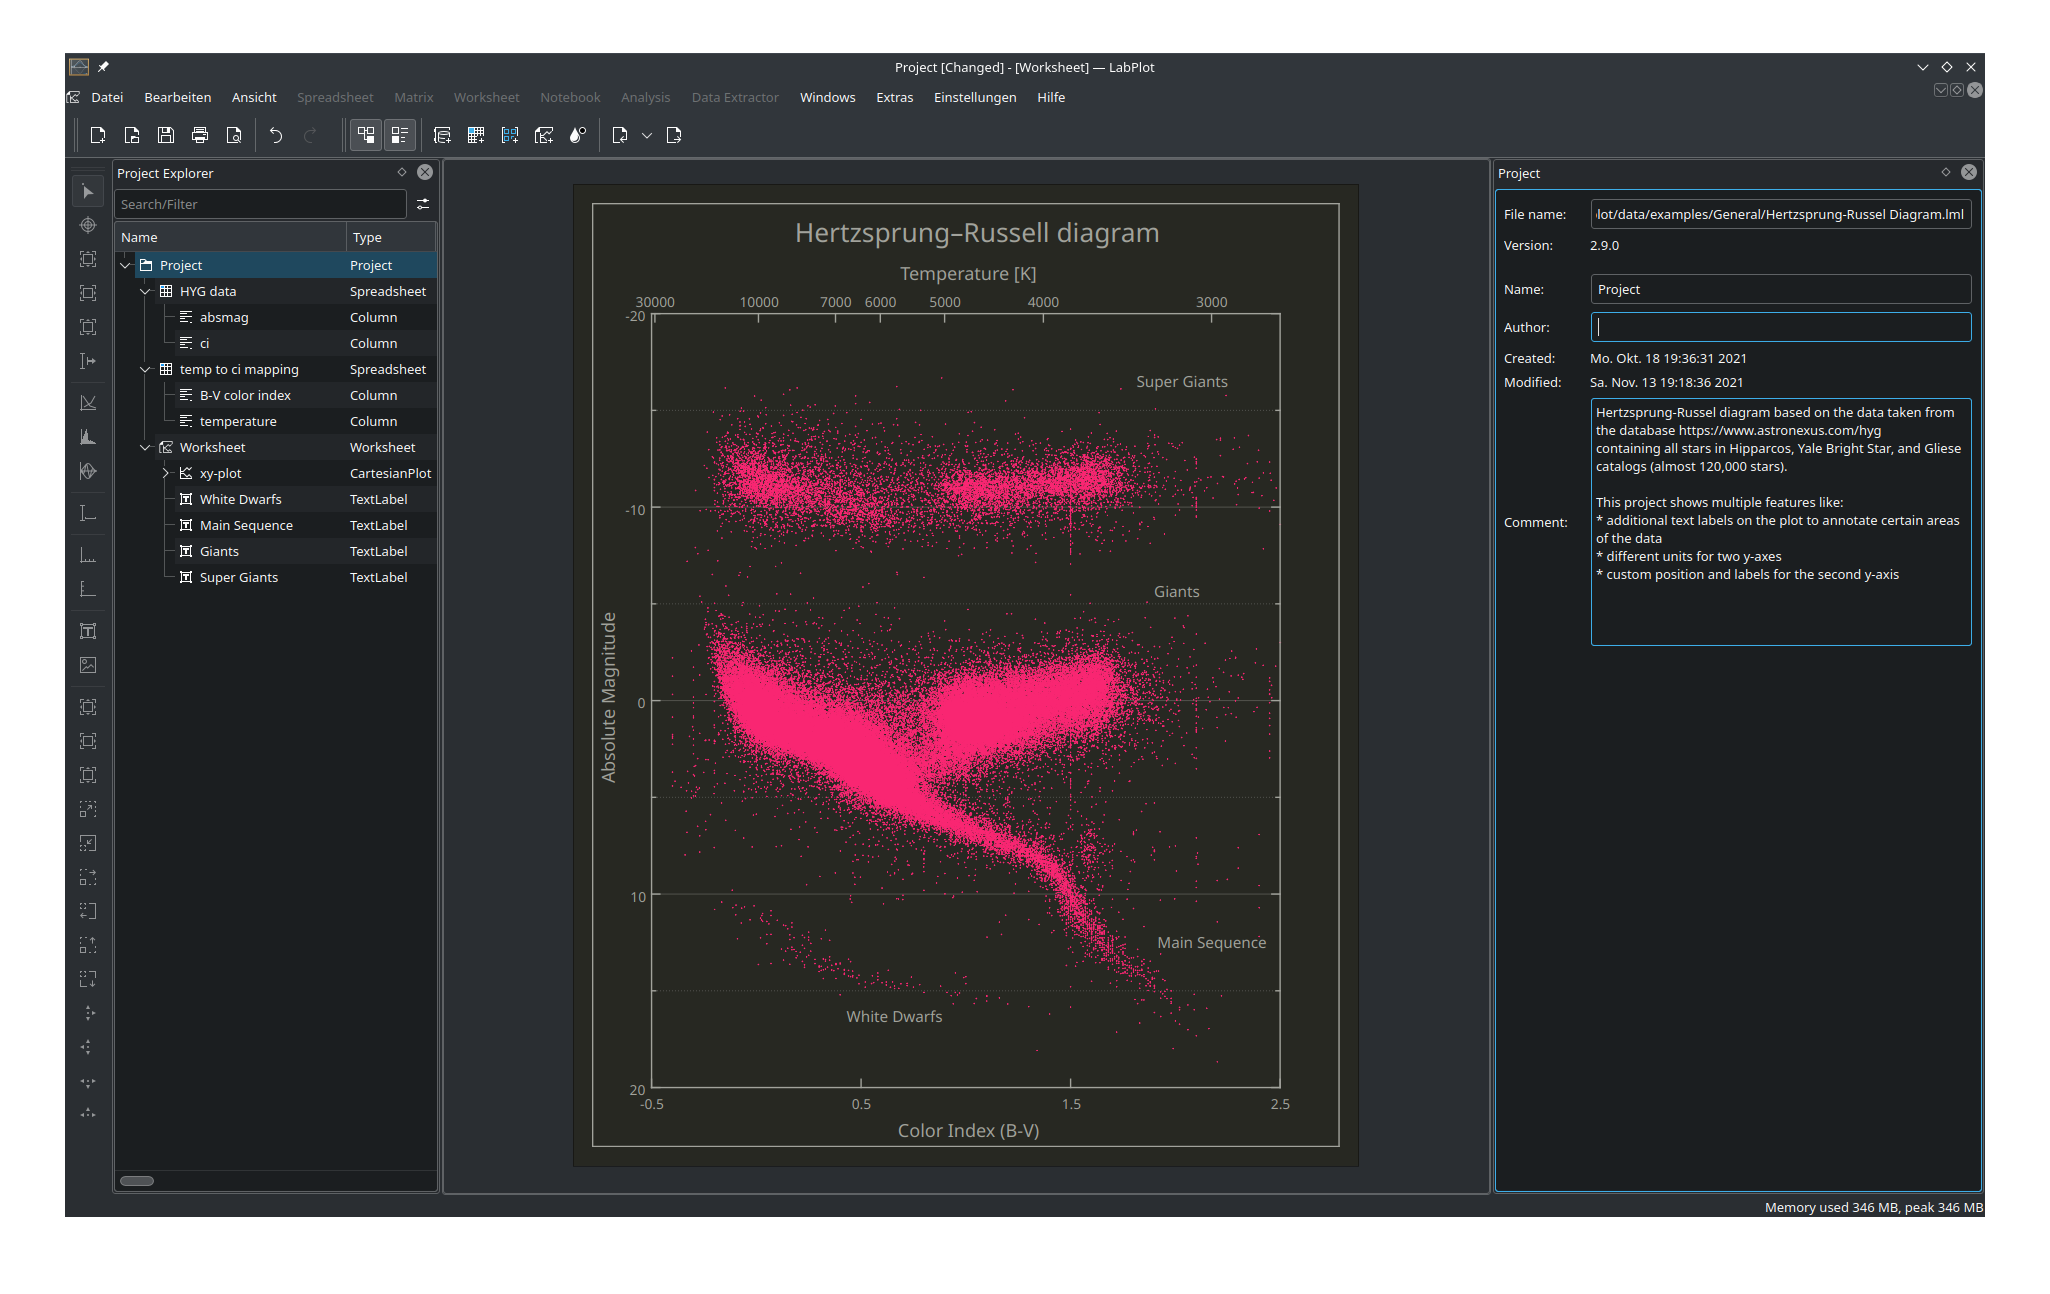
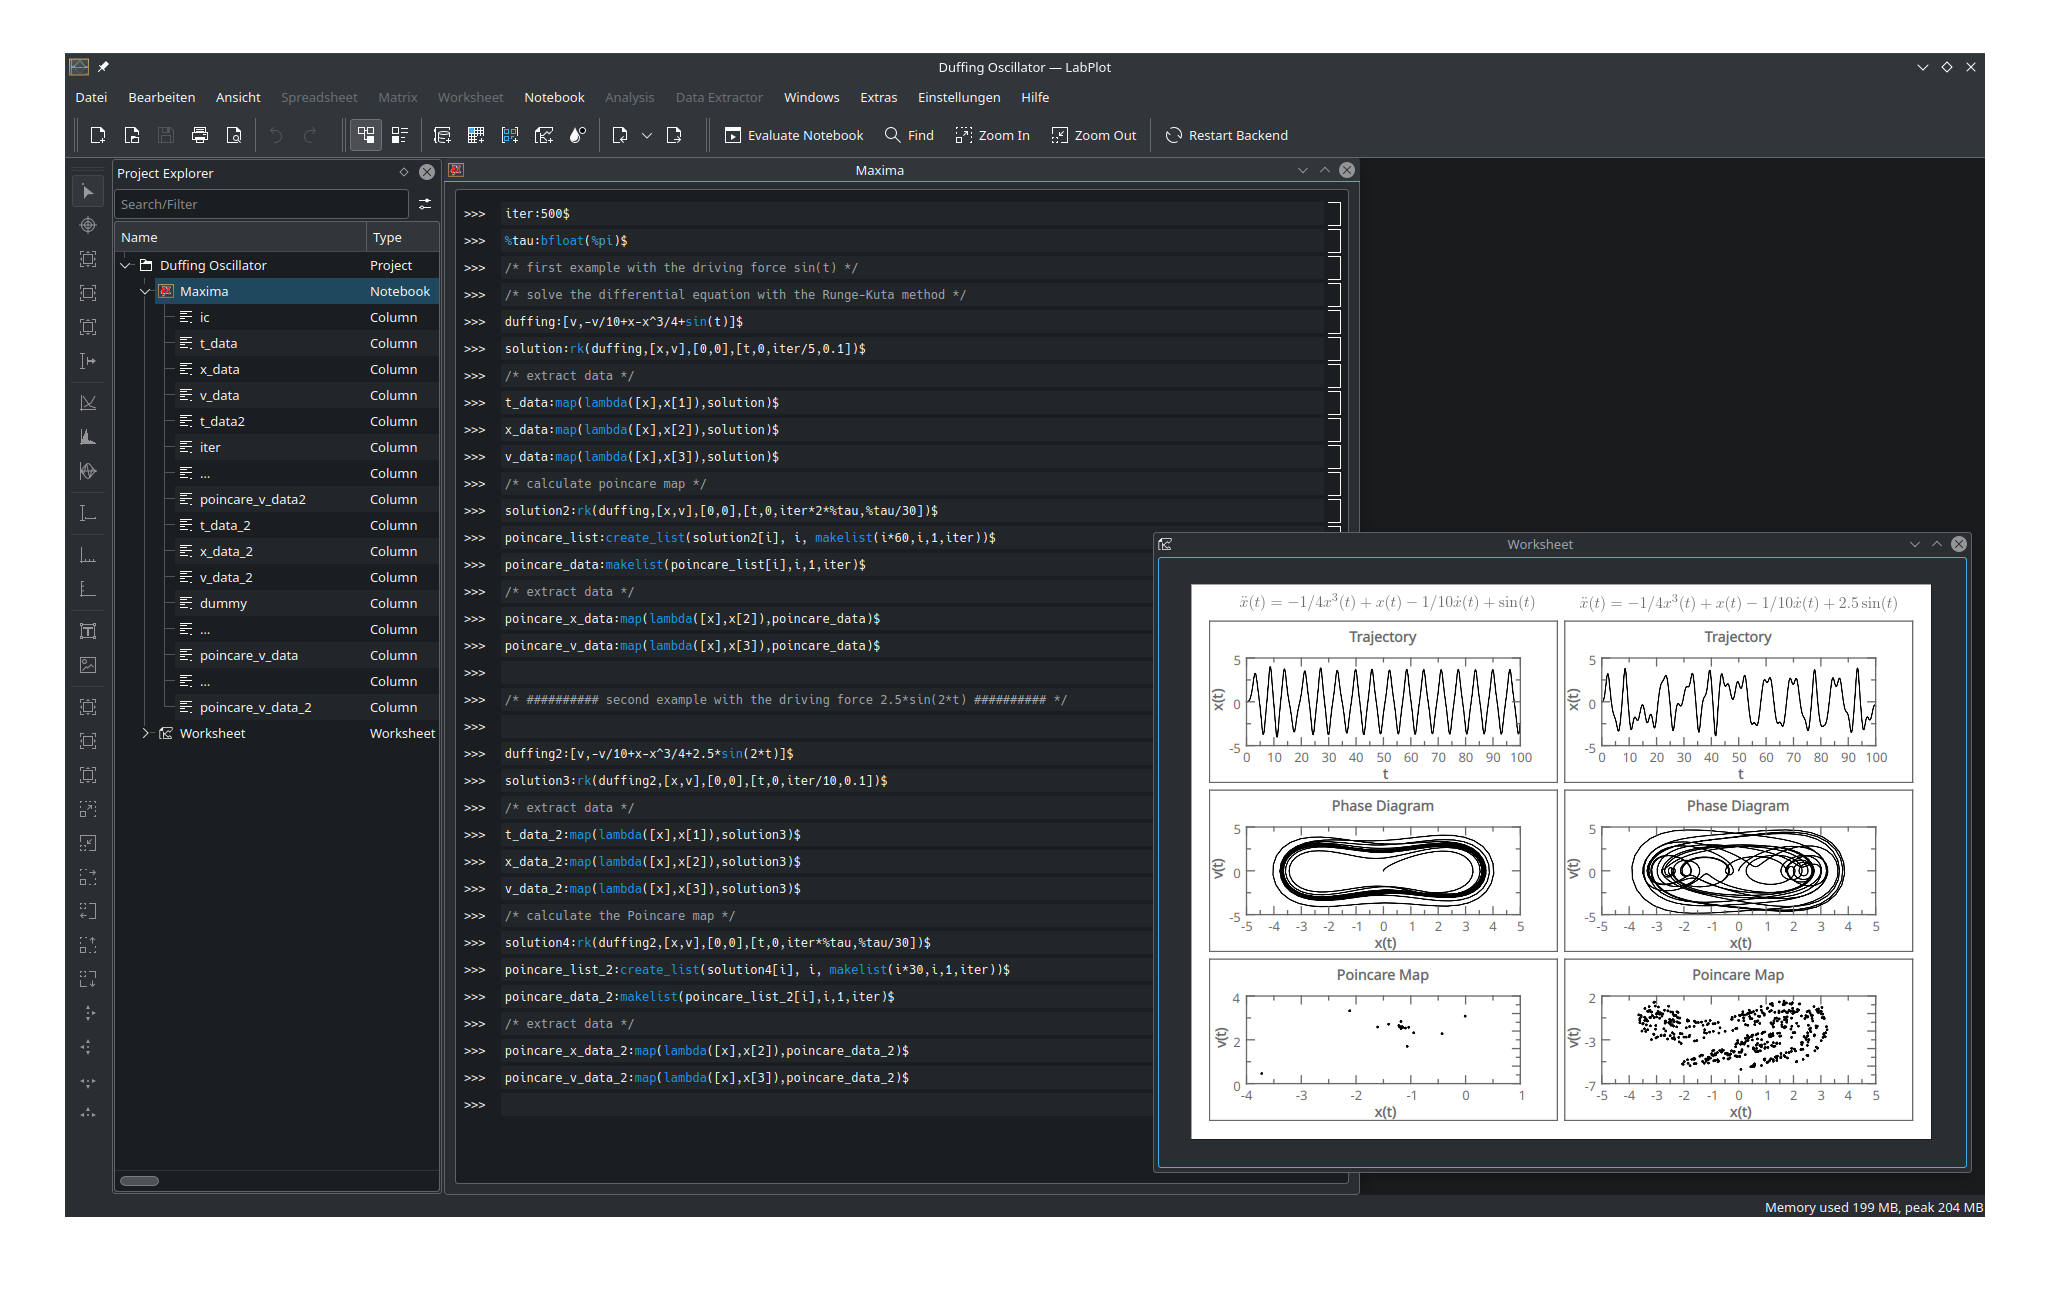
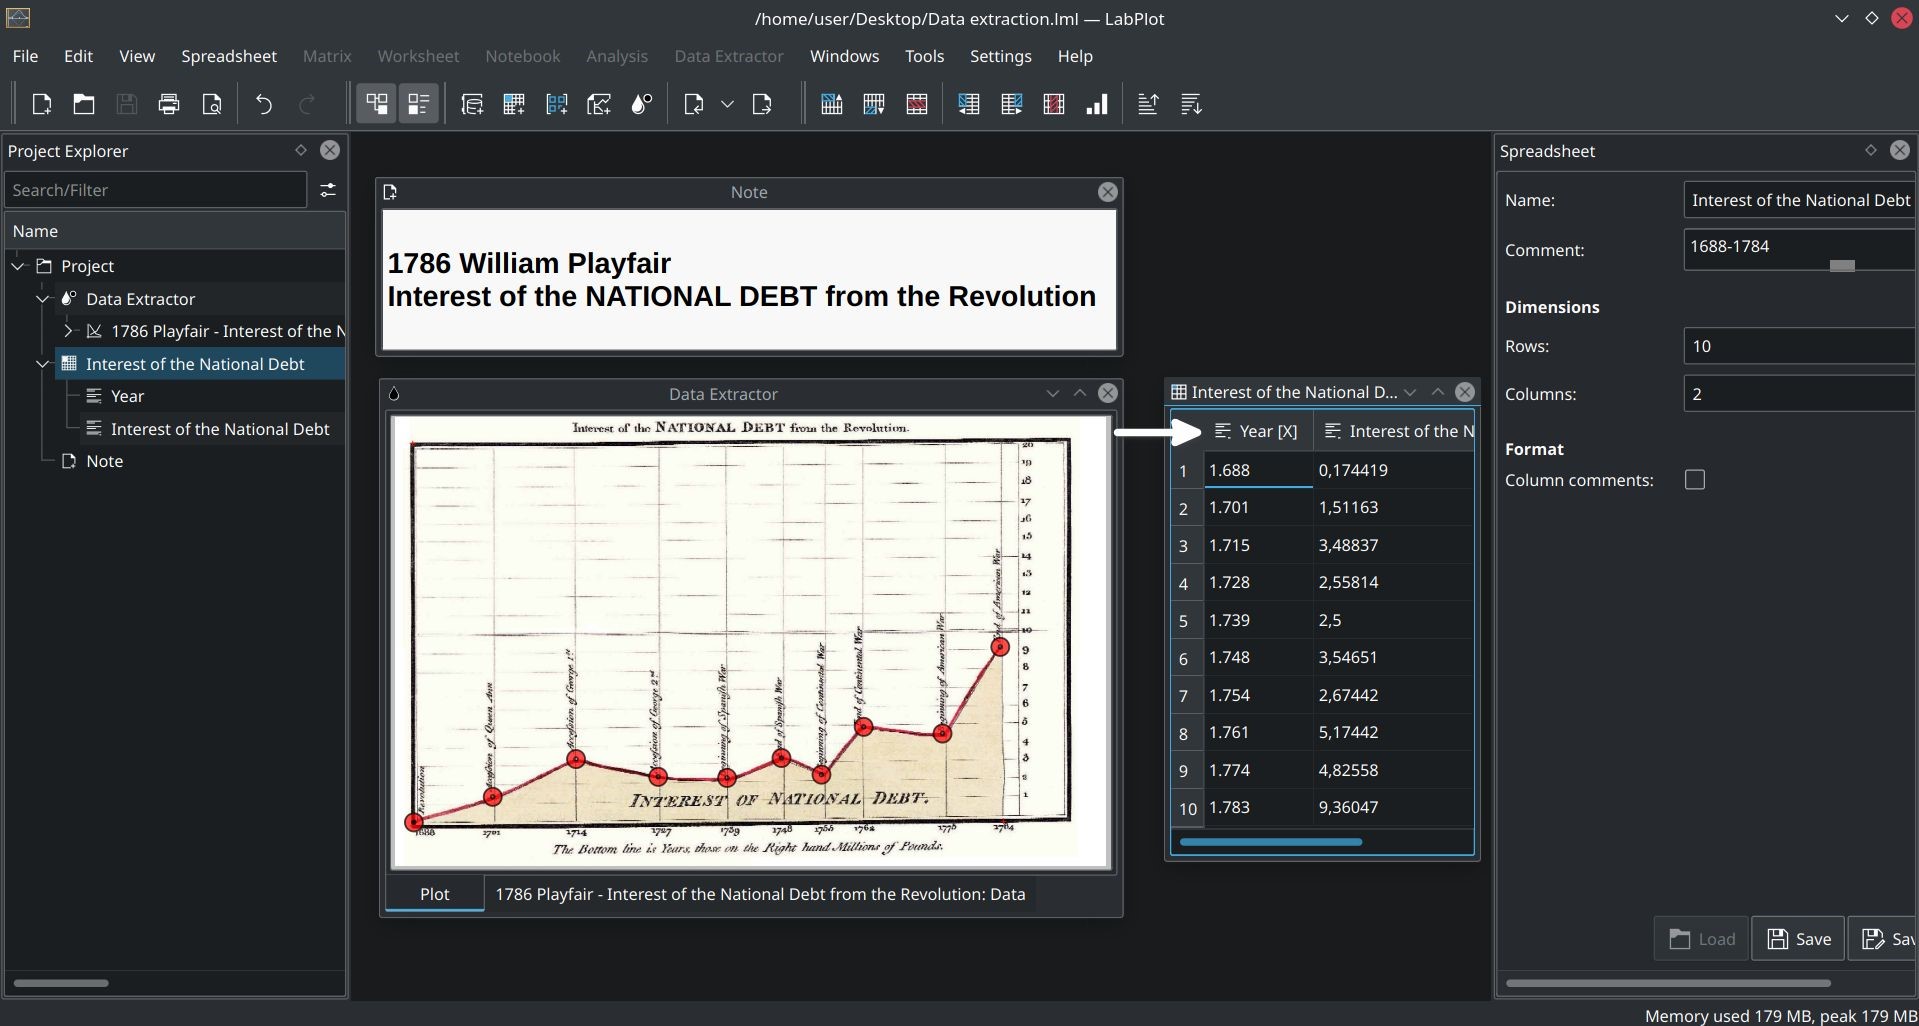
Explore LabPlot’s powerful data visualization and analysis capabilities through these screenshots and examples.
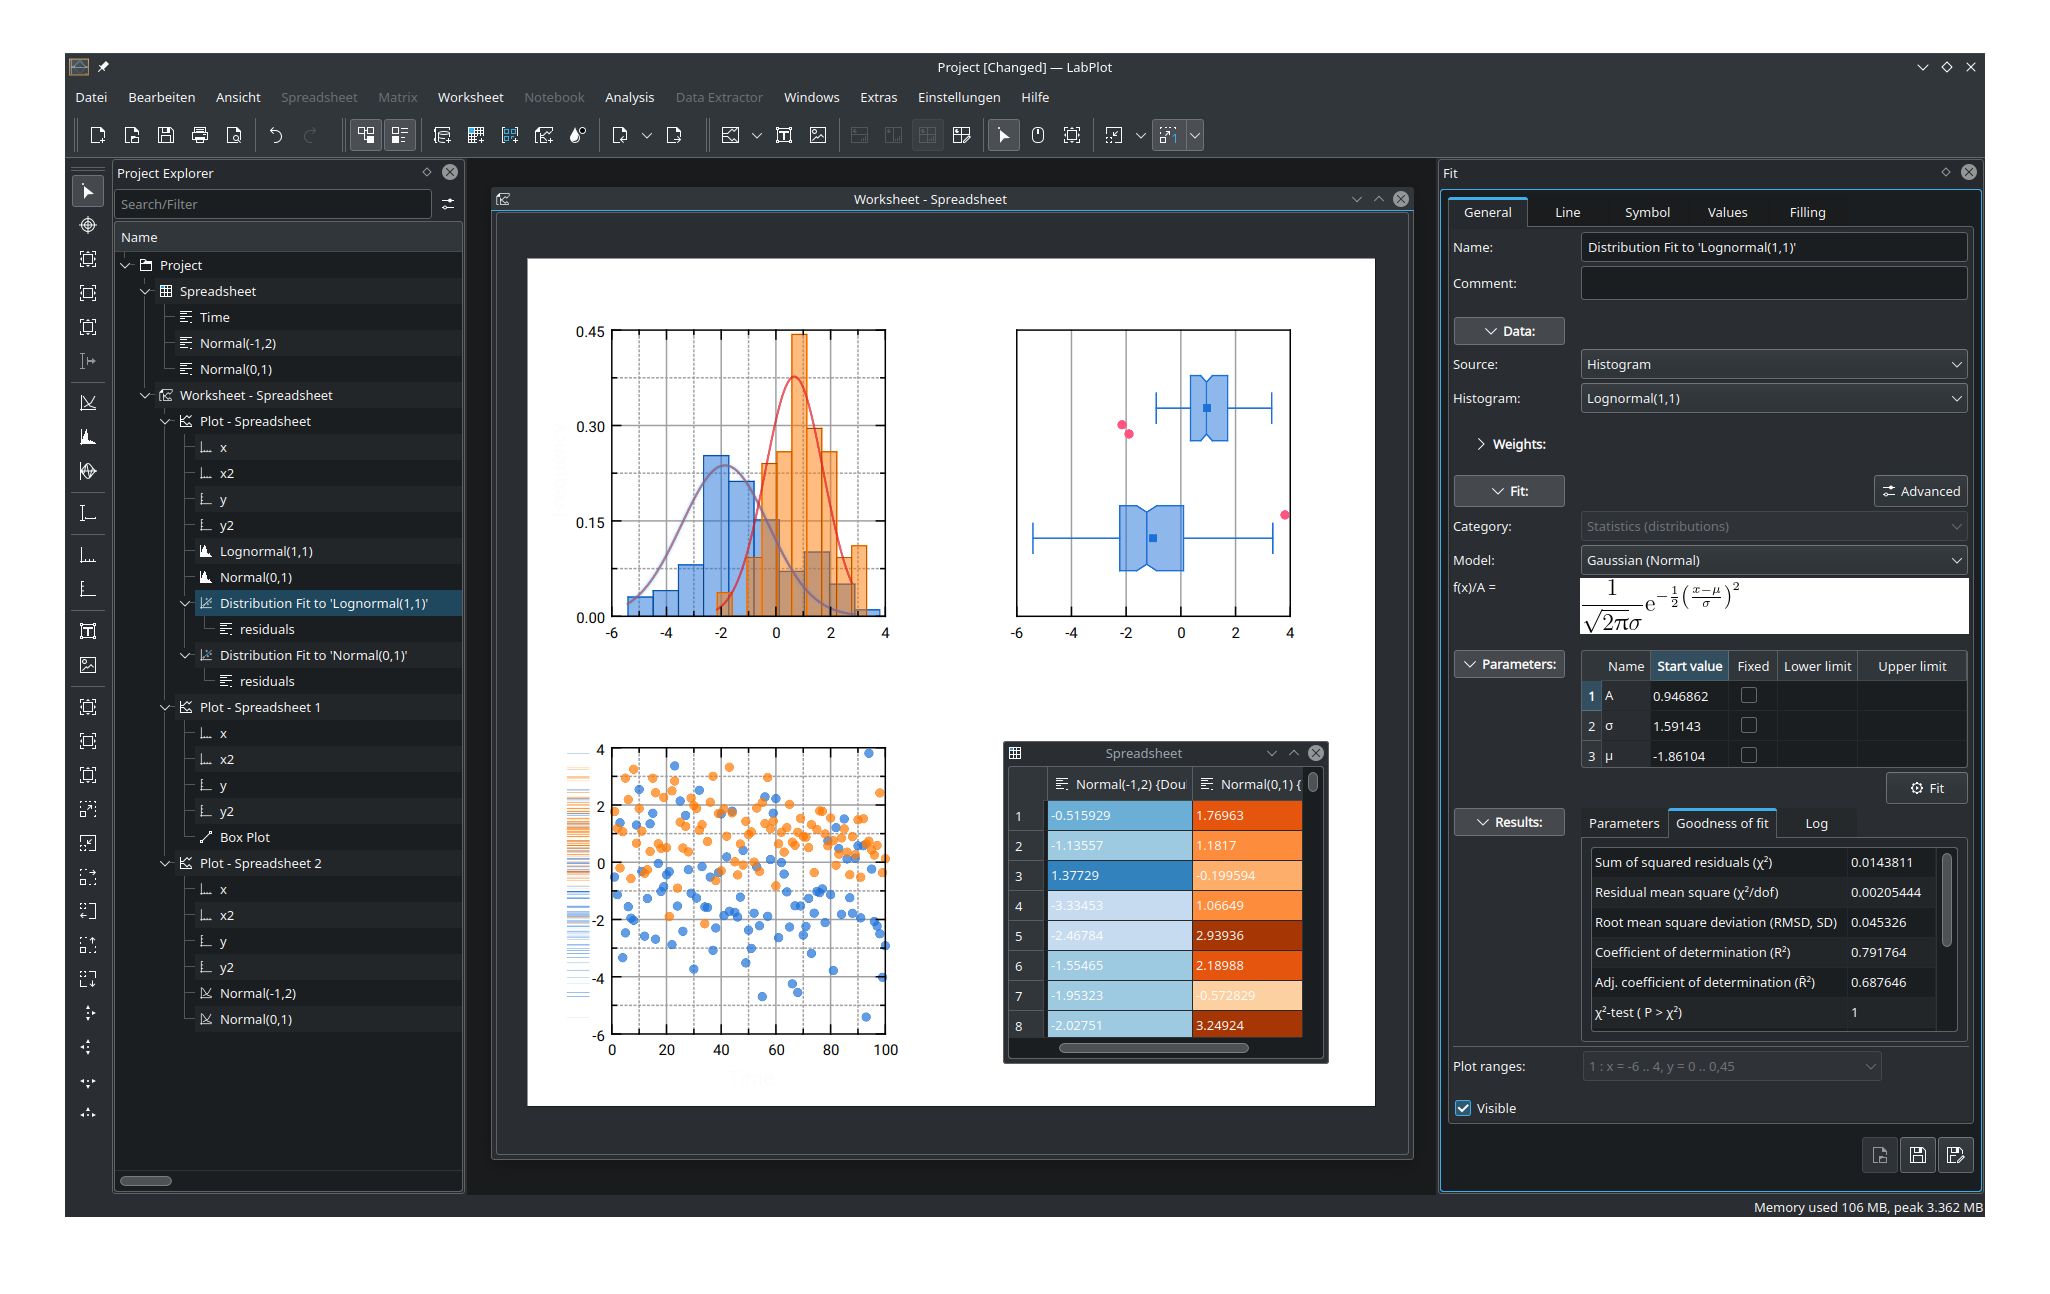
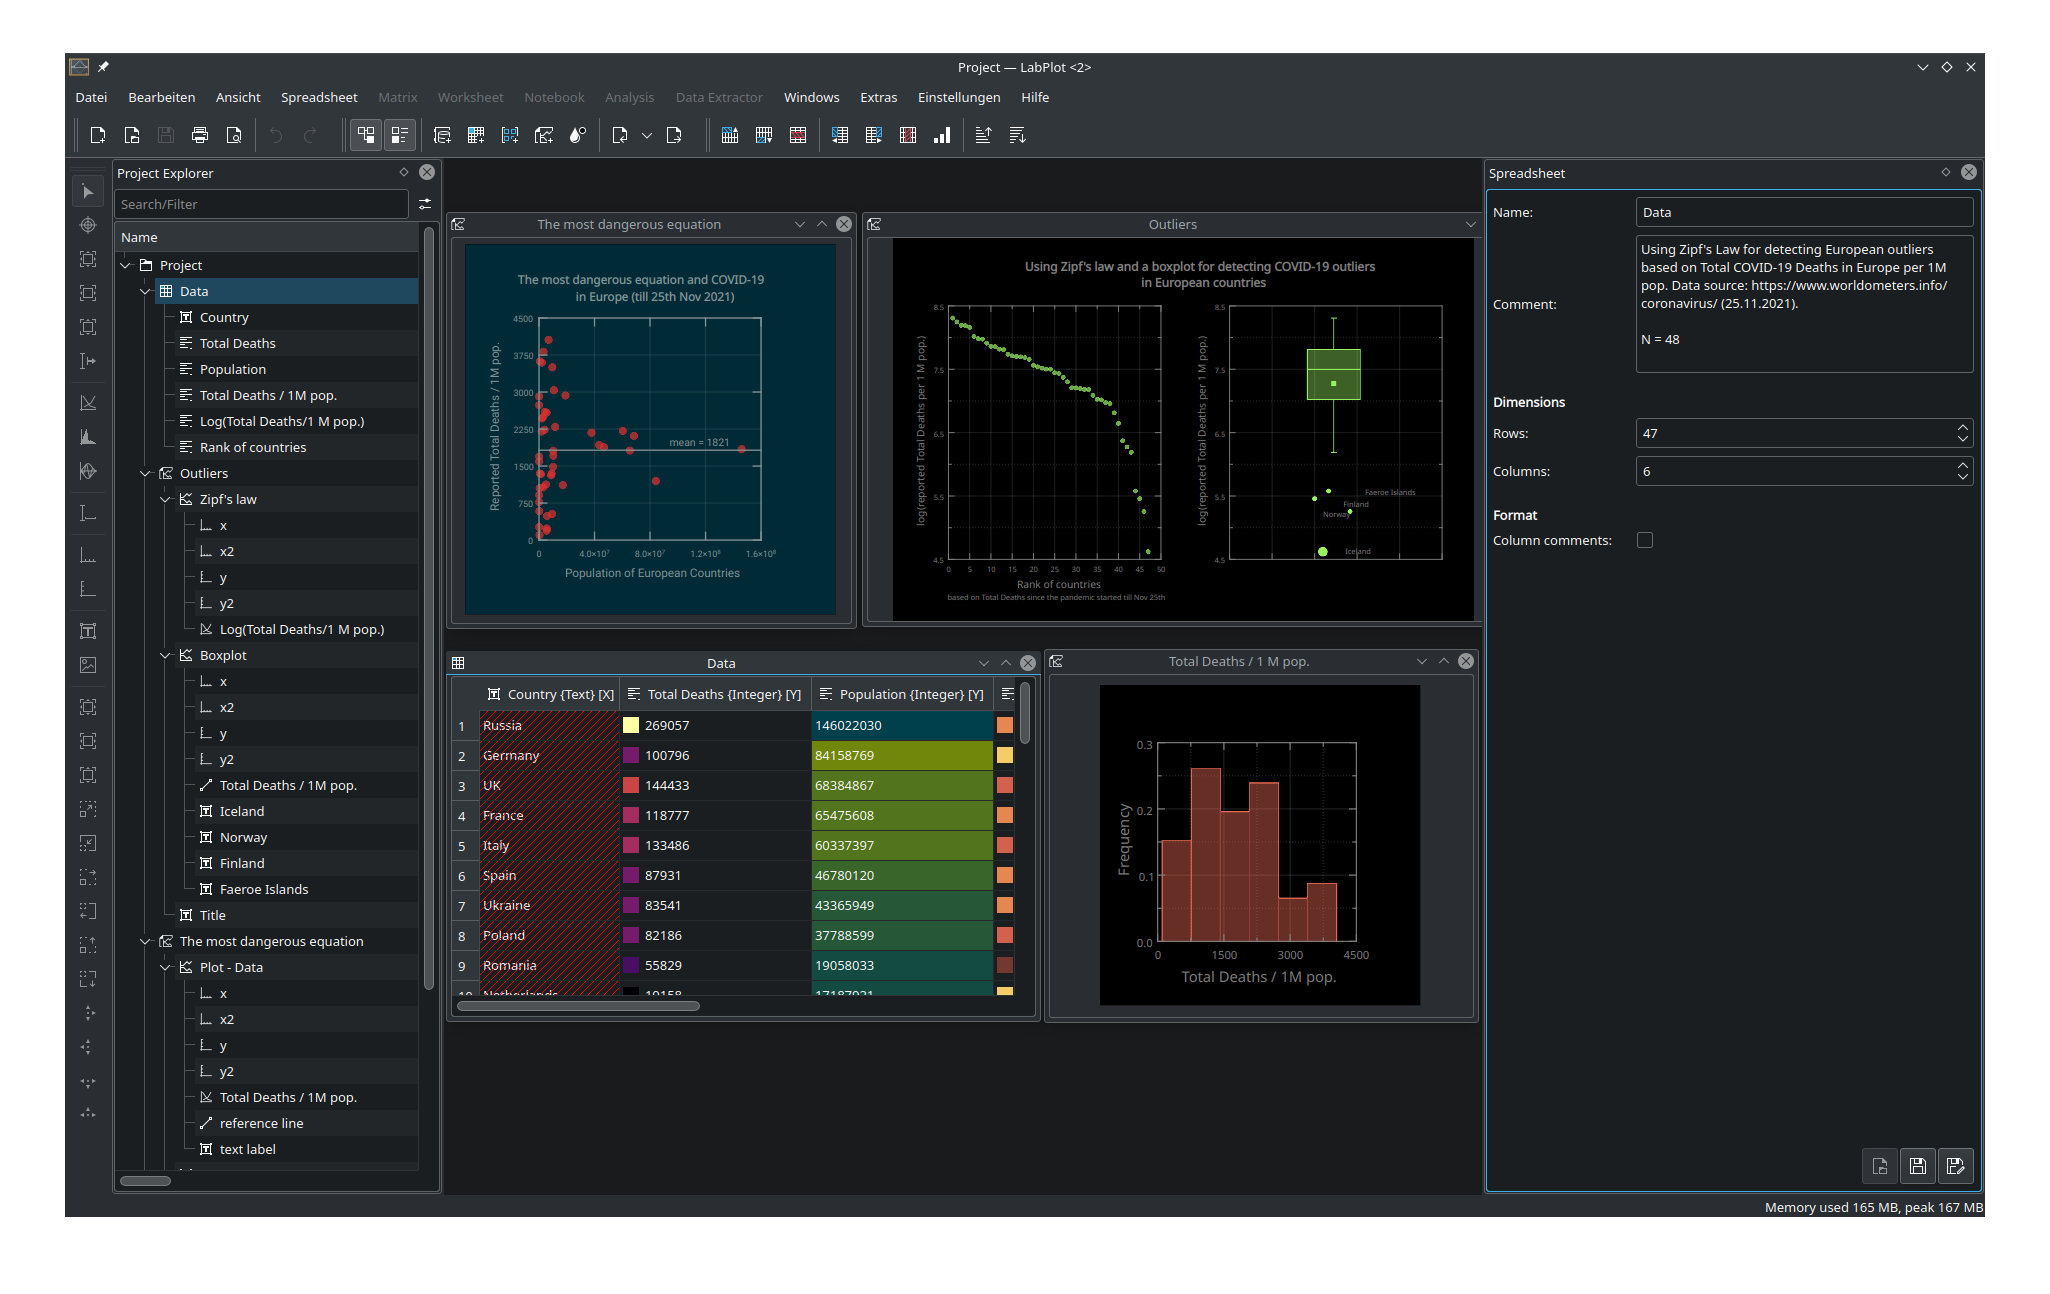
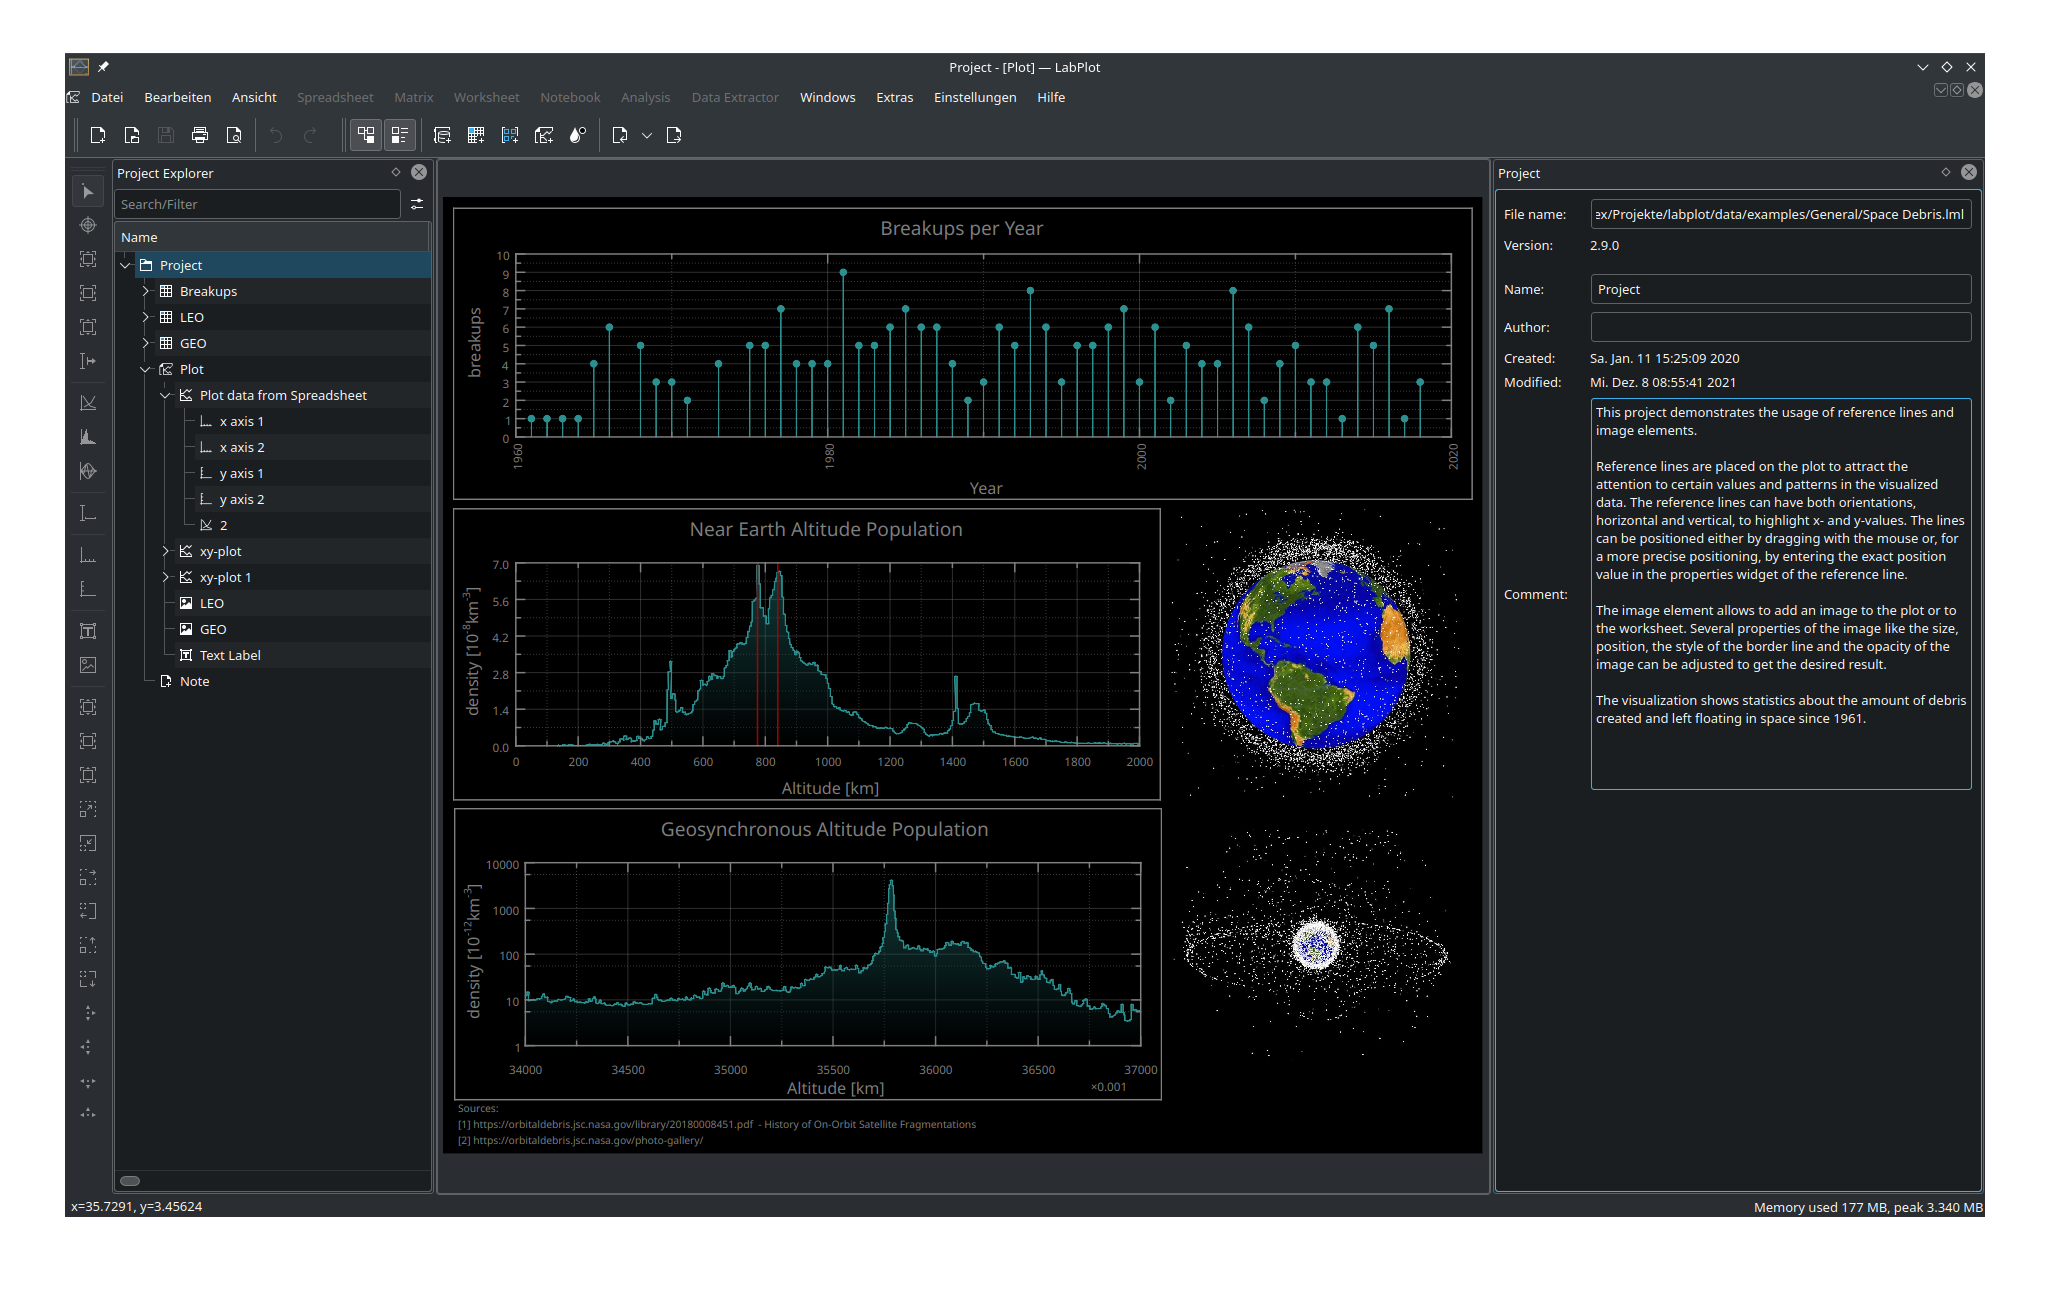
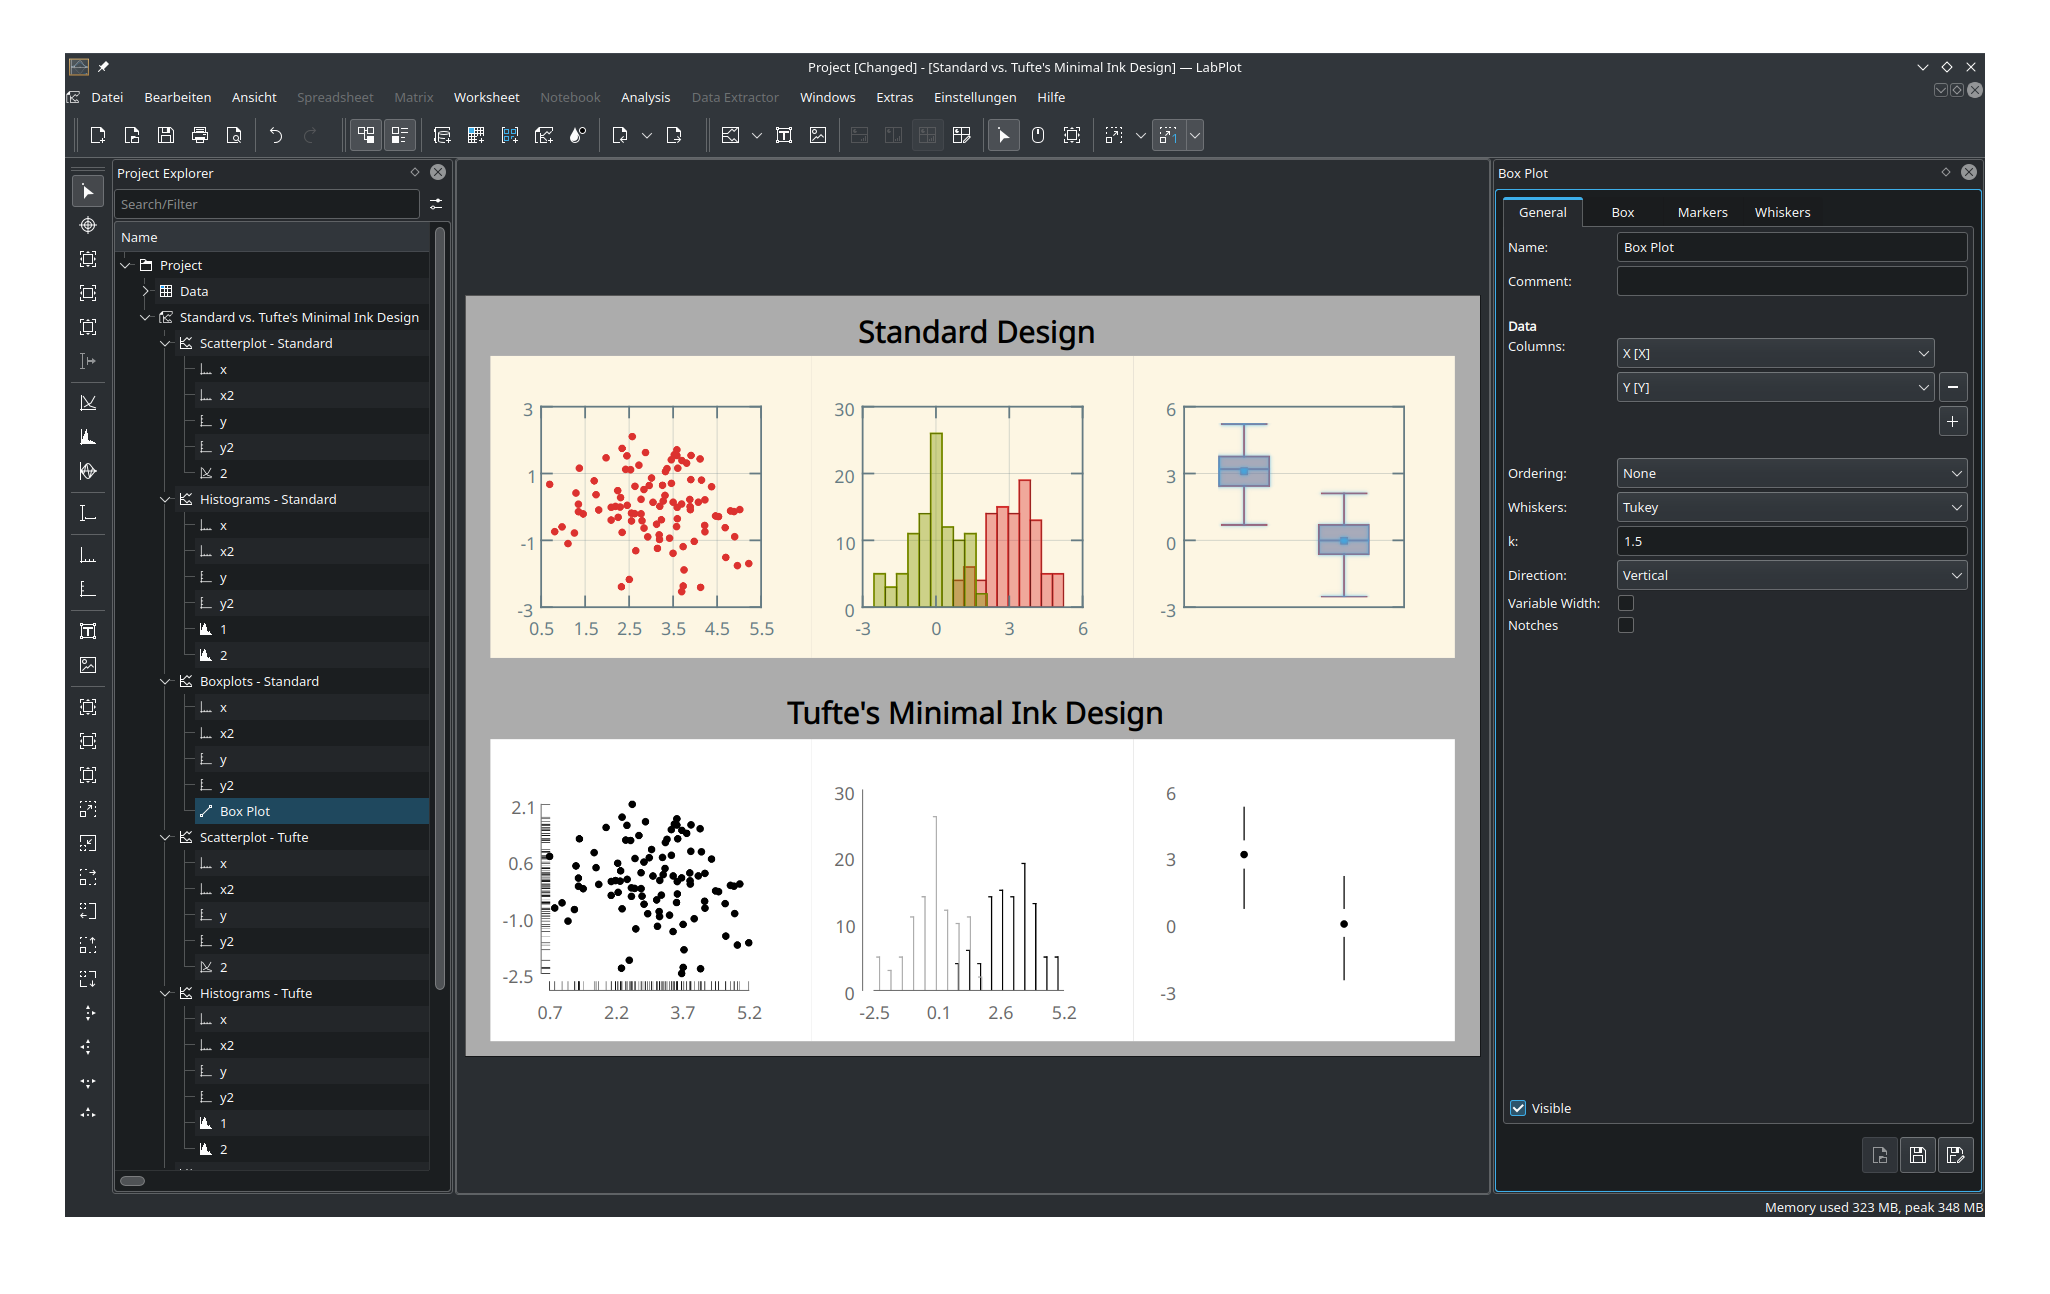
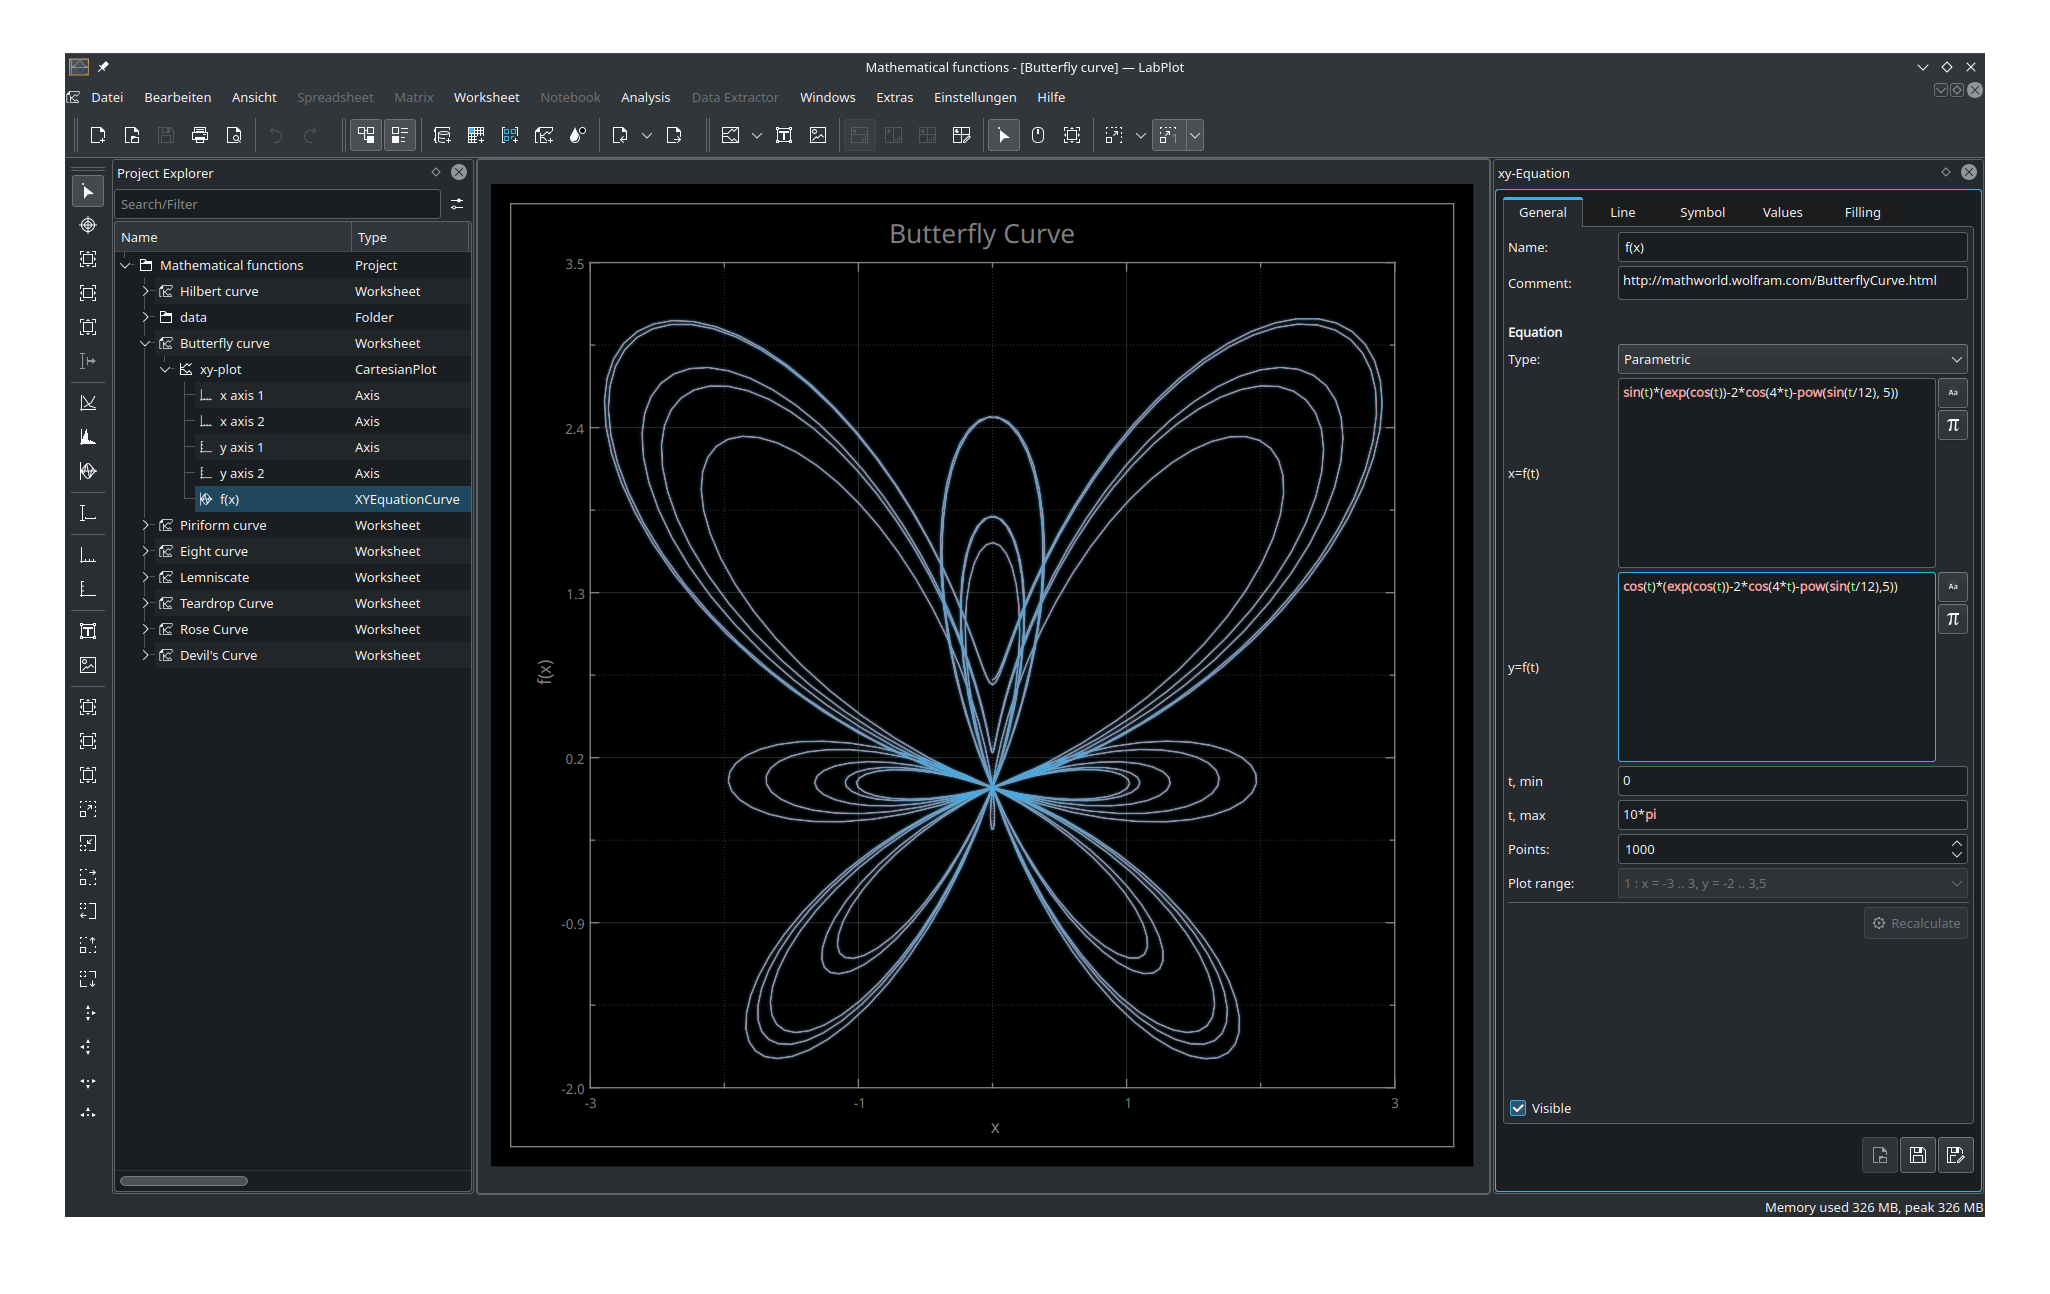
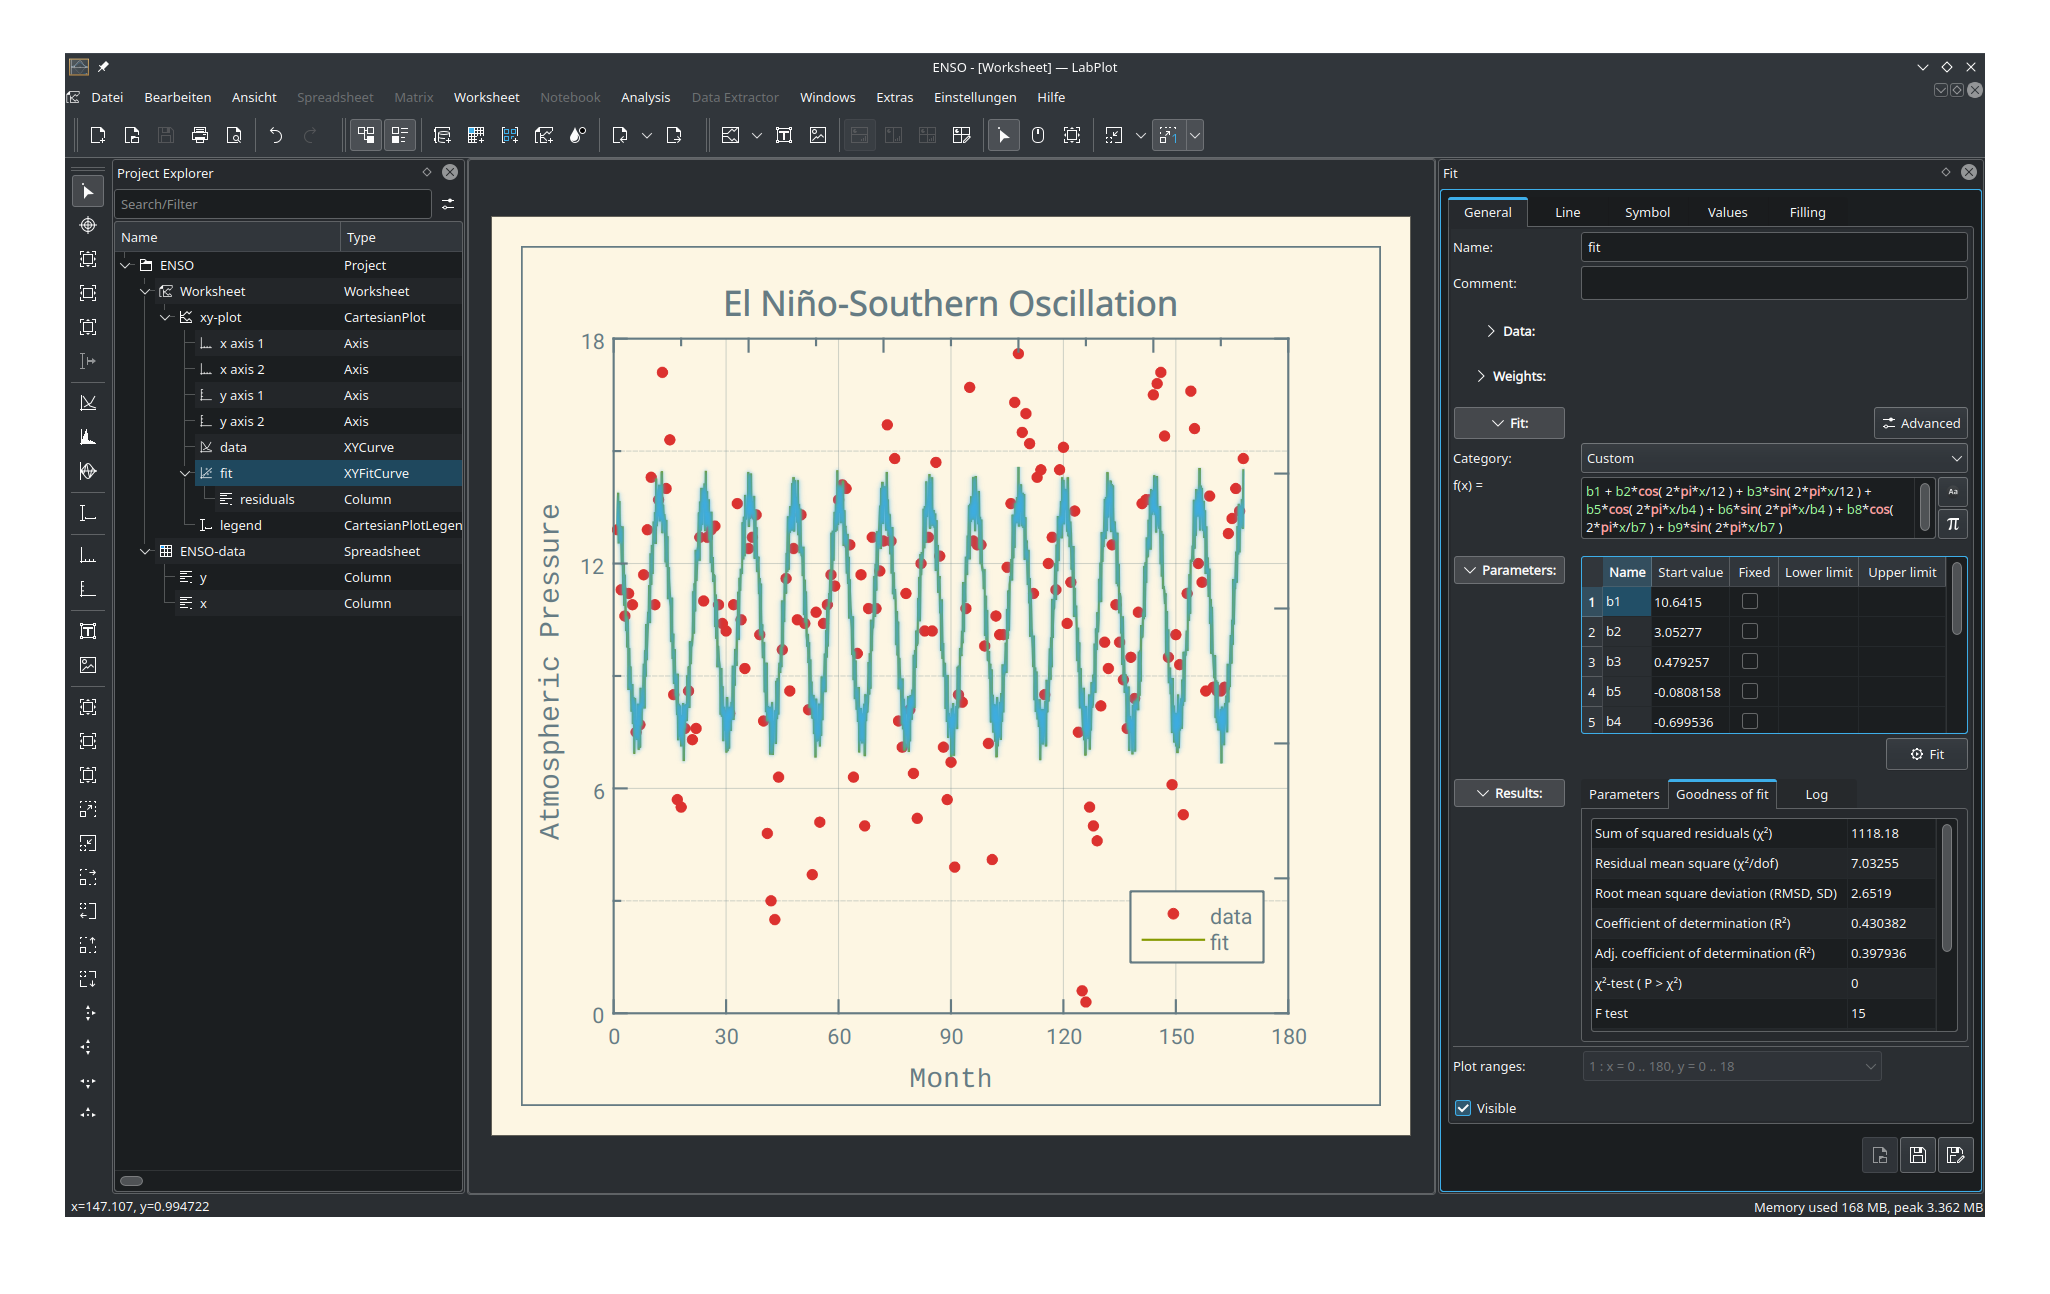
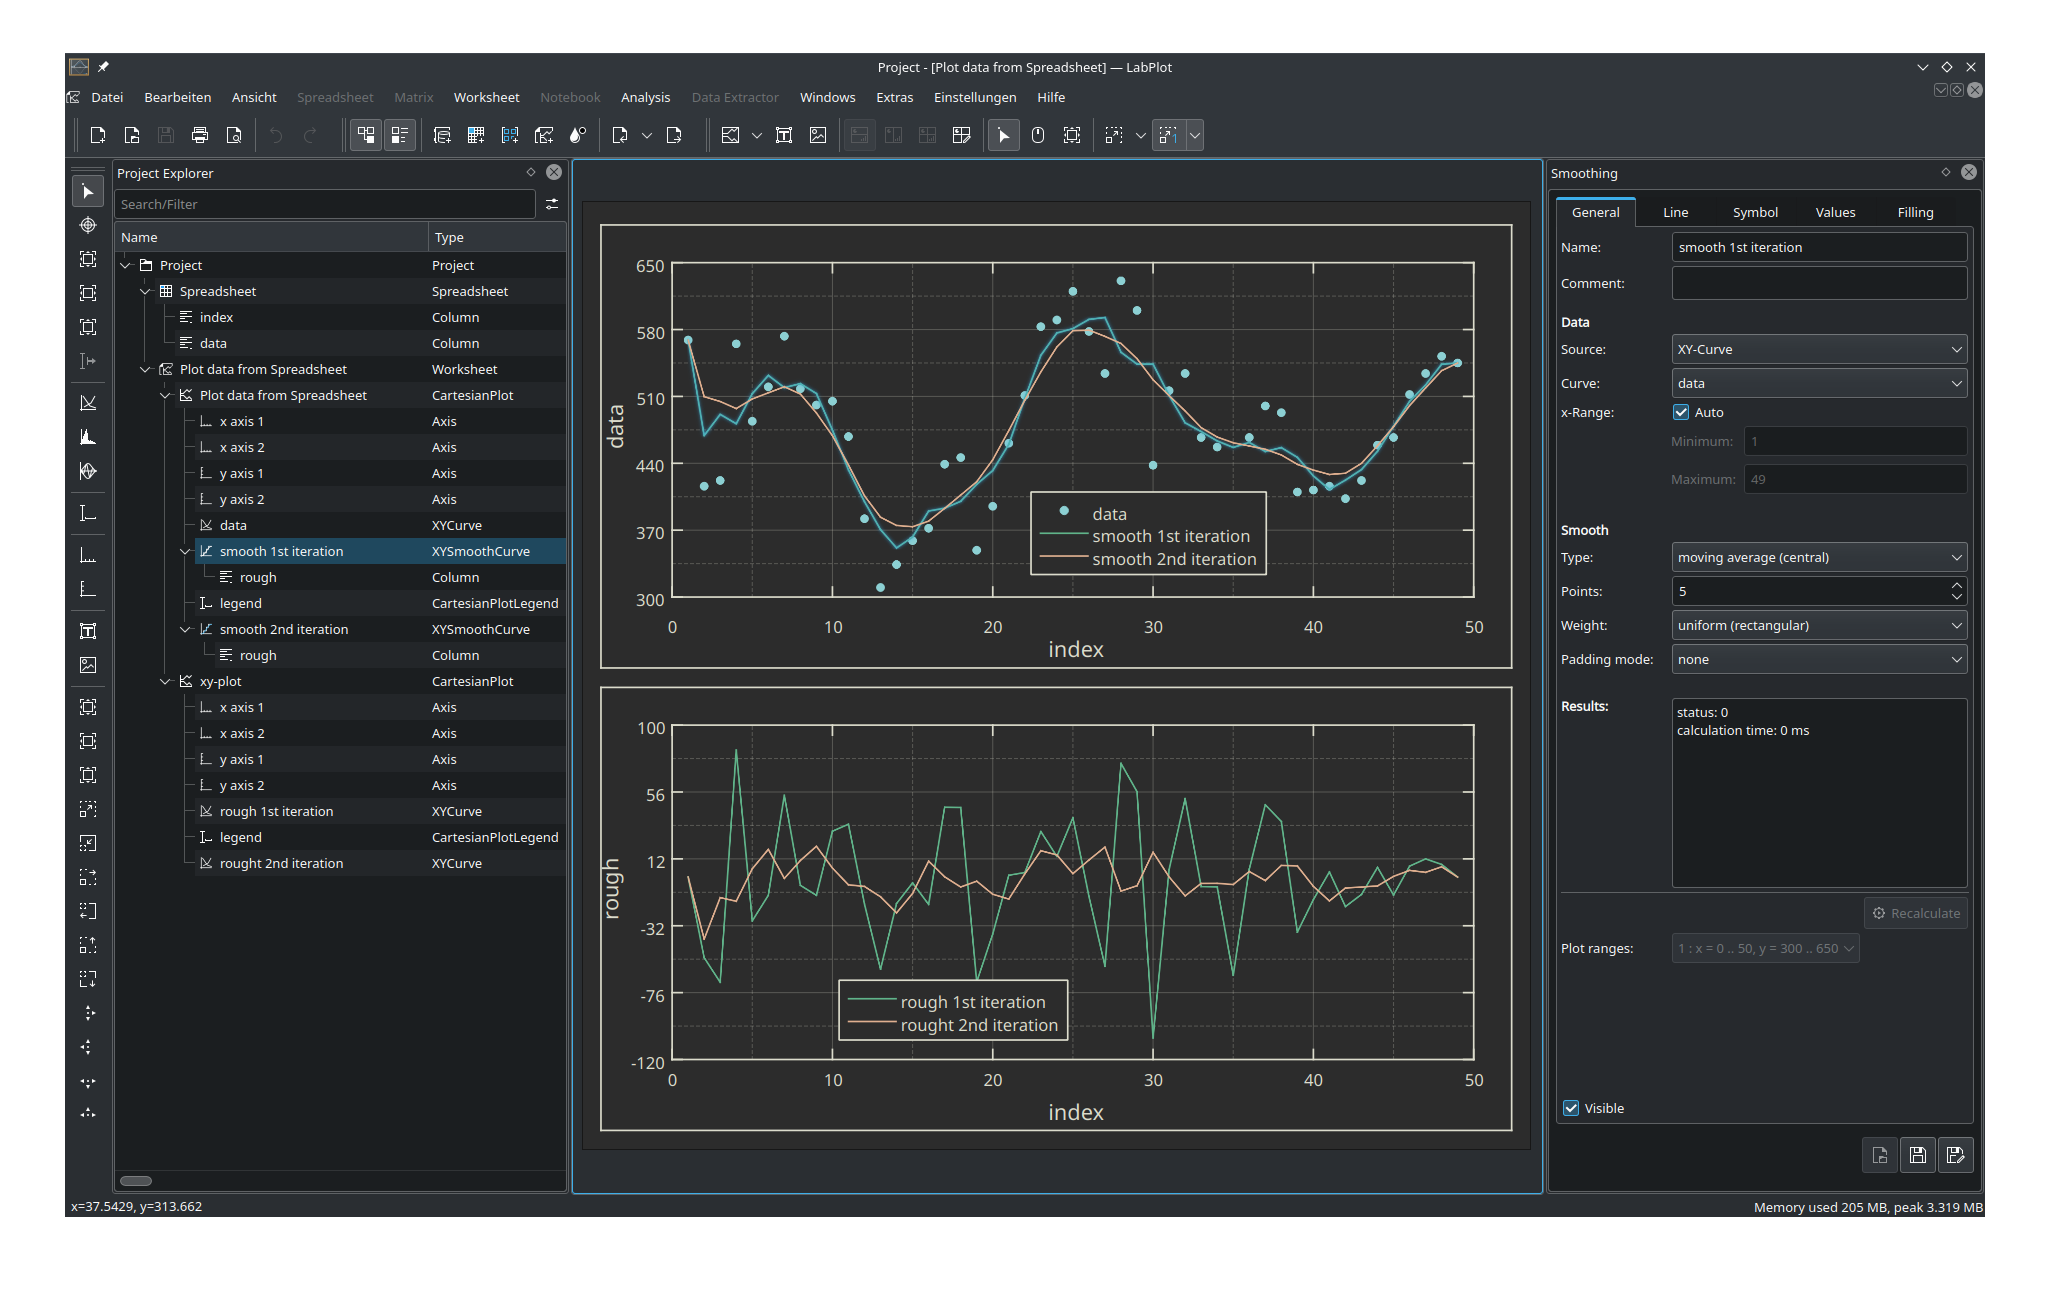
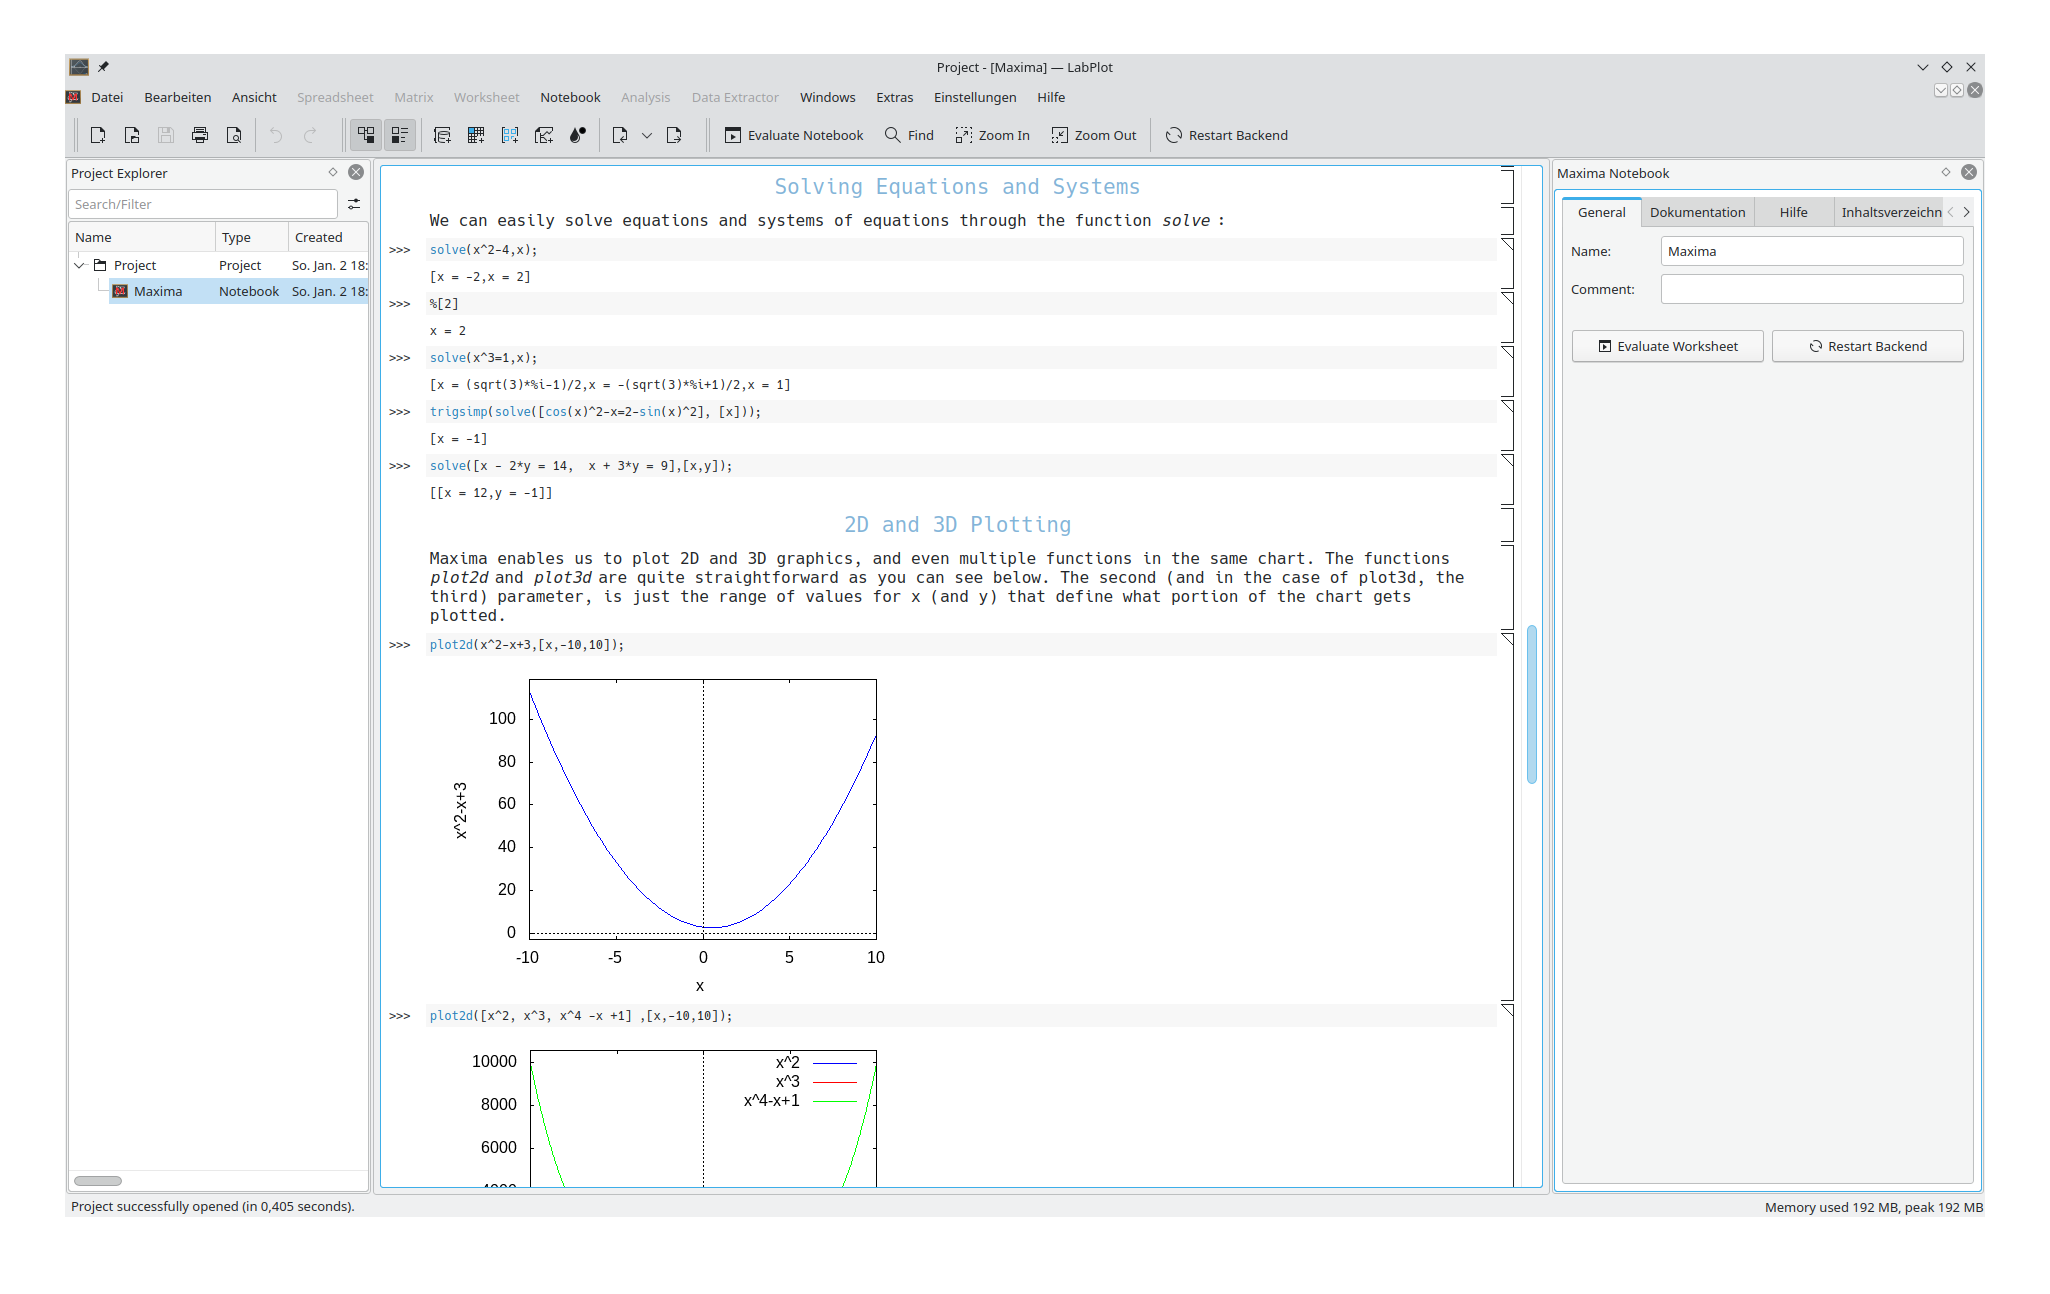
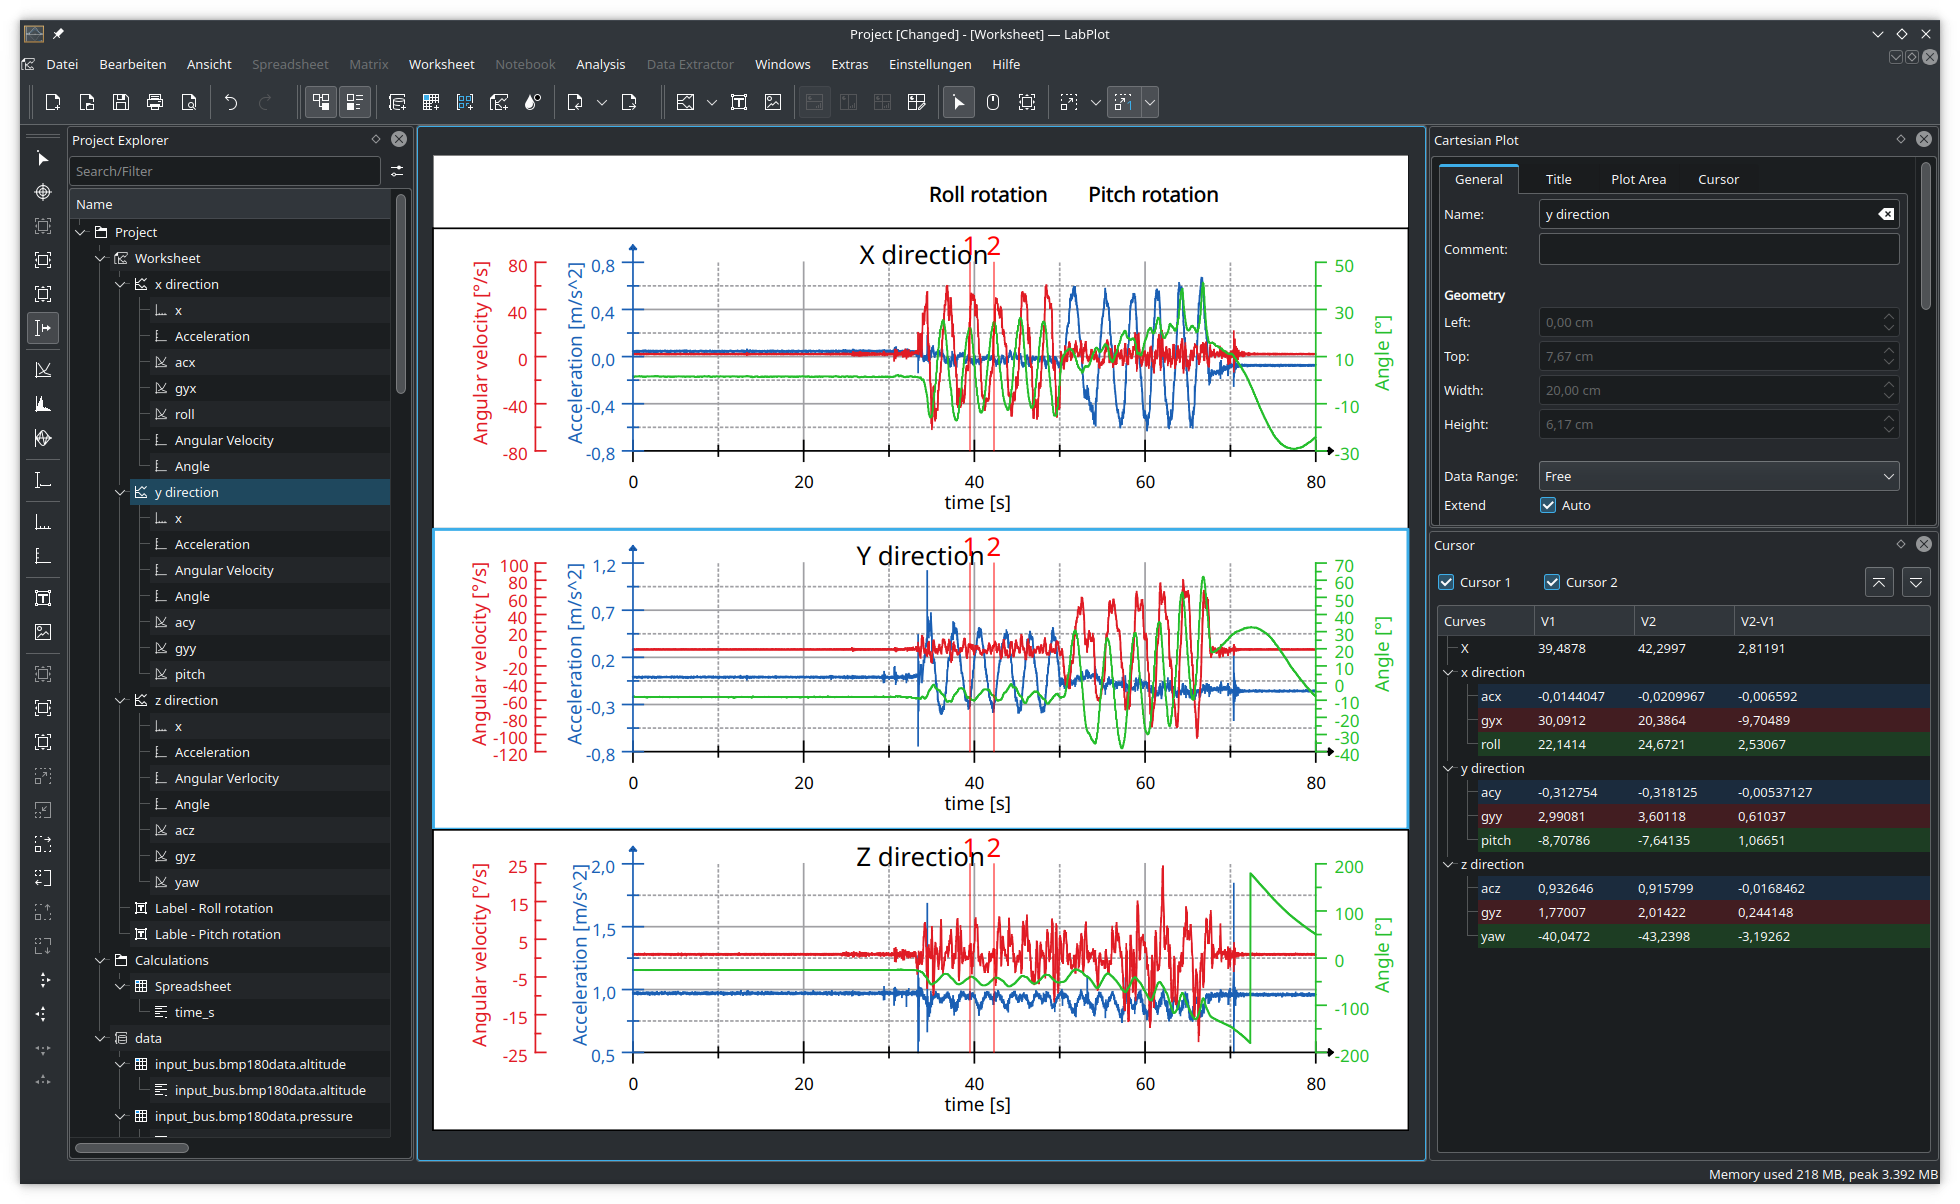
LabPlot in Action
Supported 2D Visualisations
Different visualisations can be categorised using seven relationship types (nominal comparison, time series, ranking, part-to-whole, deviation, frequency distribution, correlation) and four encoding objects (points, lines, bars, boxes). Below is a selection of examples created in LabPlot that fall into the different categories.
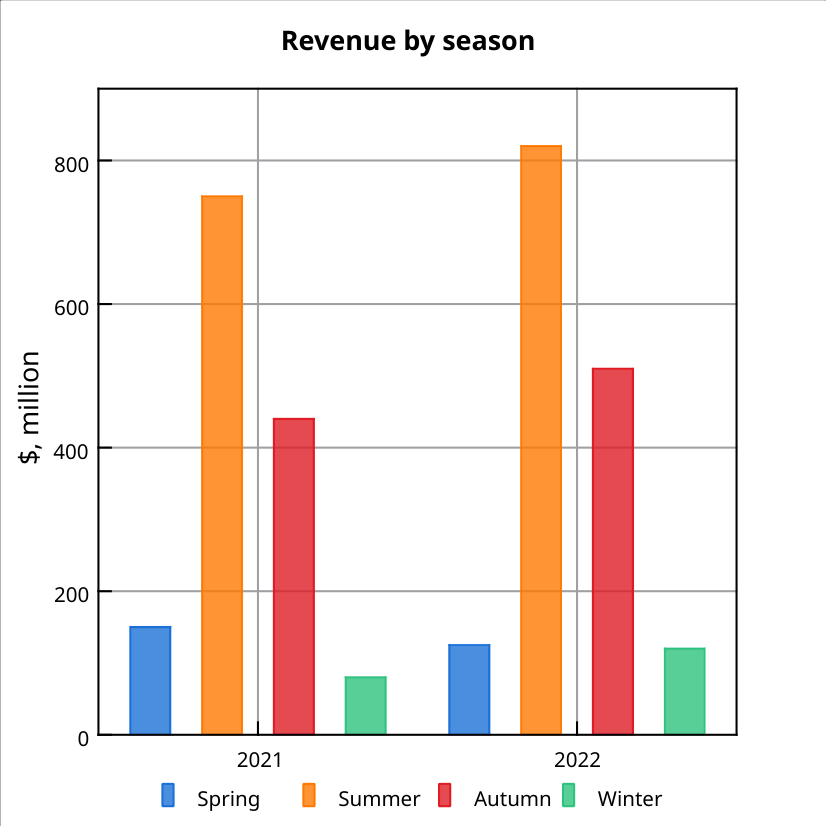
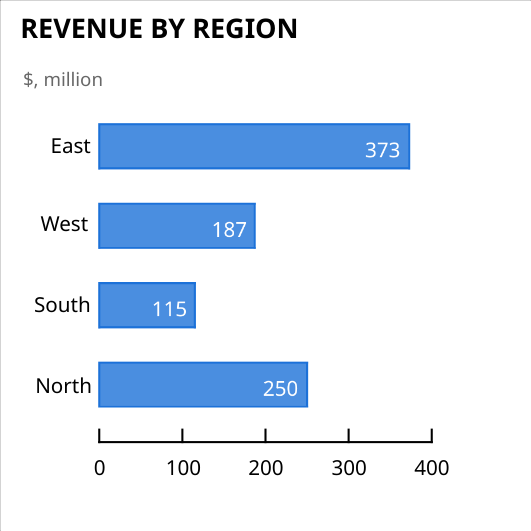
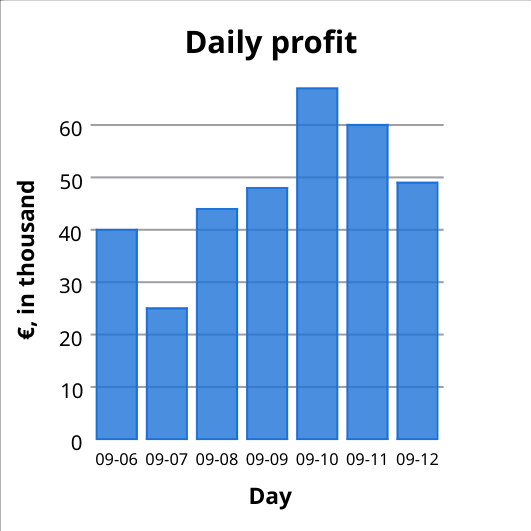
Nominal Comparison
Contrasts numerical metrics across various subcategories.
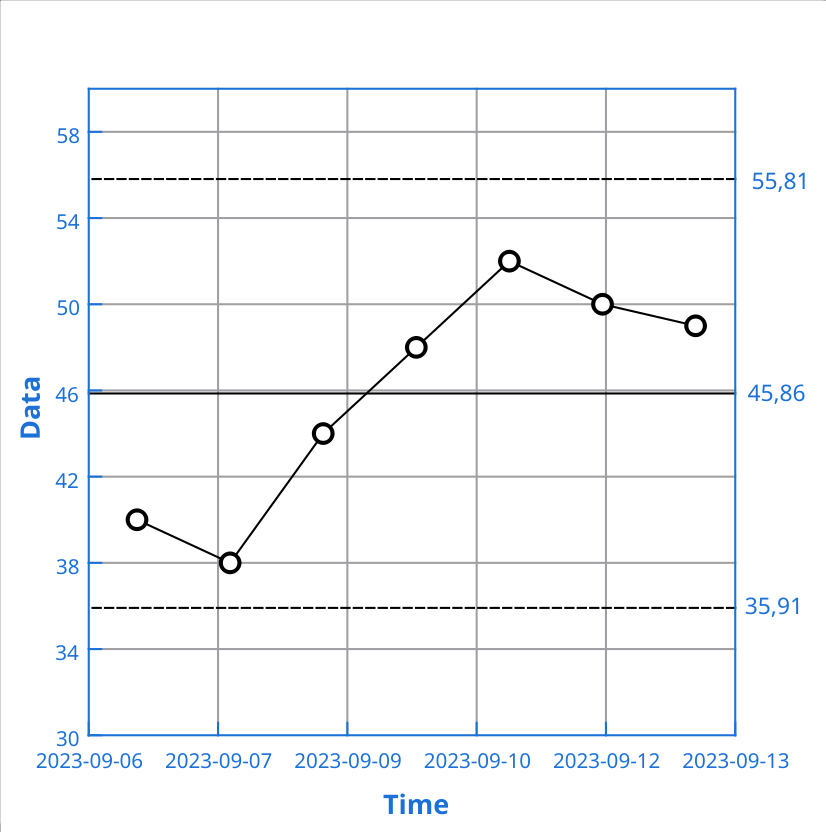
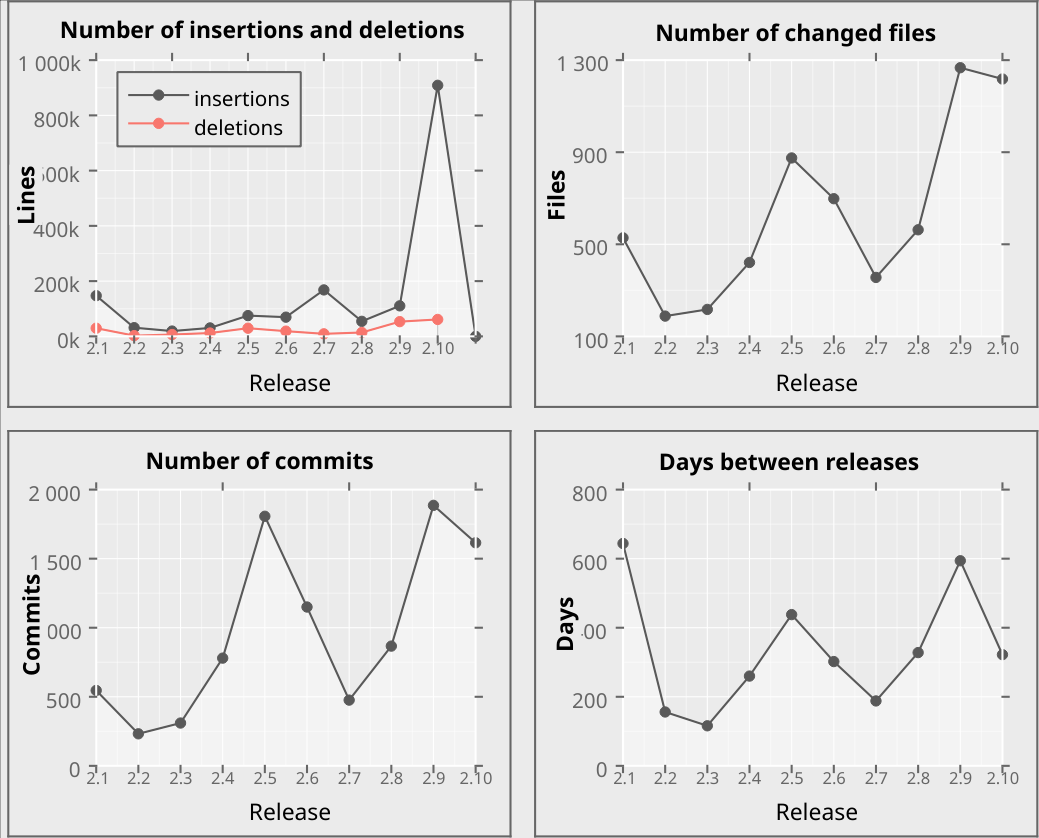
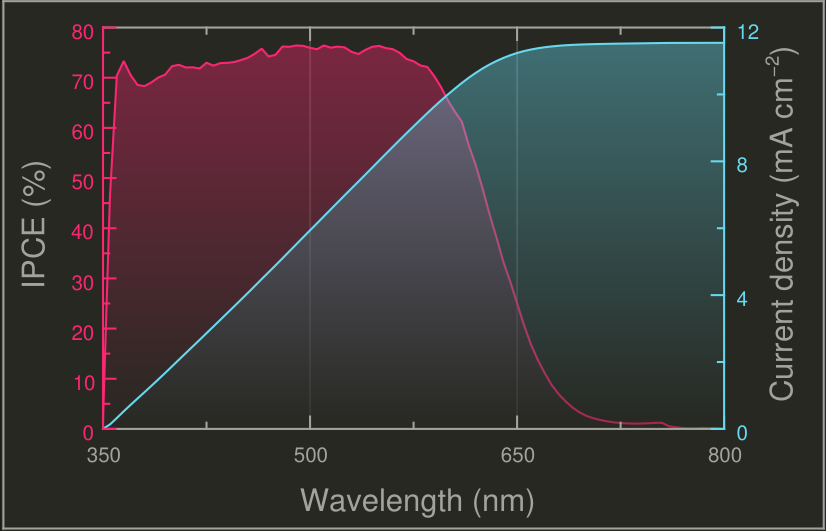
Time Series
Tracks change in value of a metric over time.
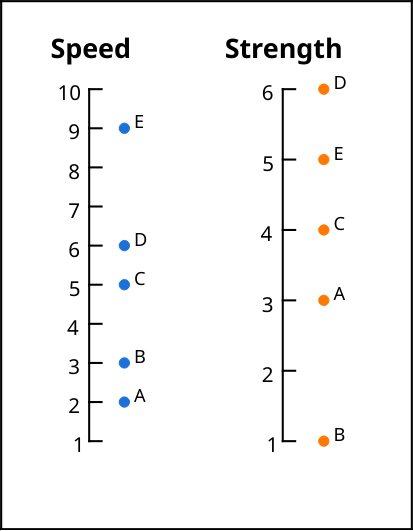
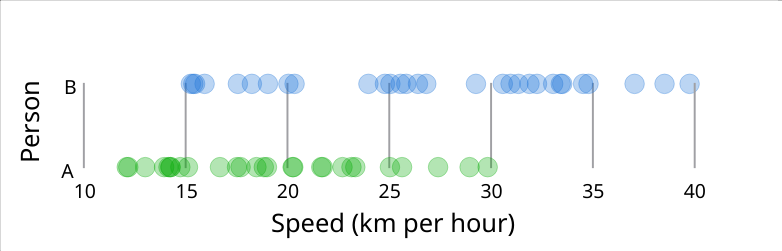
Ranking
Illustrates how multiple values compare to each other in relative magnitude.
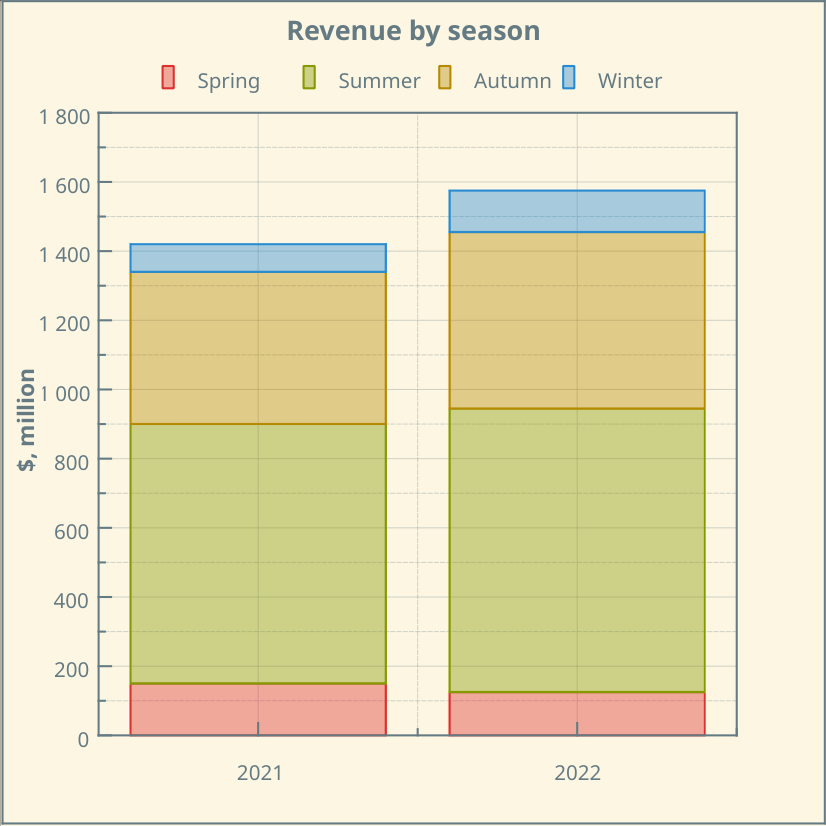
Part to Whole
Displays a subset of data in relation to the larger whole, typically used to illustrate proportions or percentages.
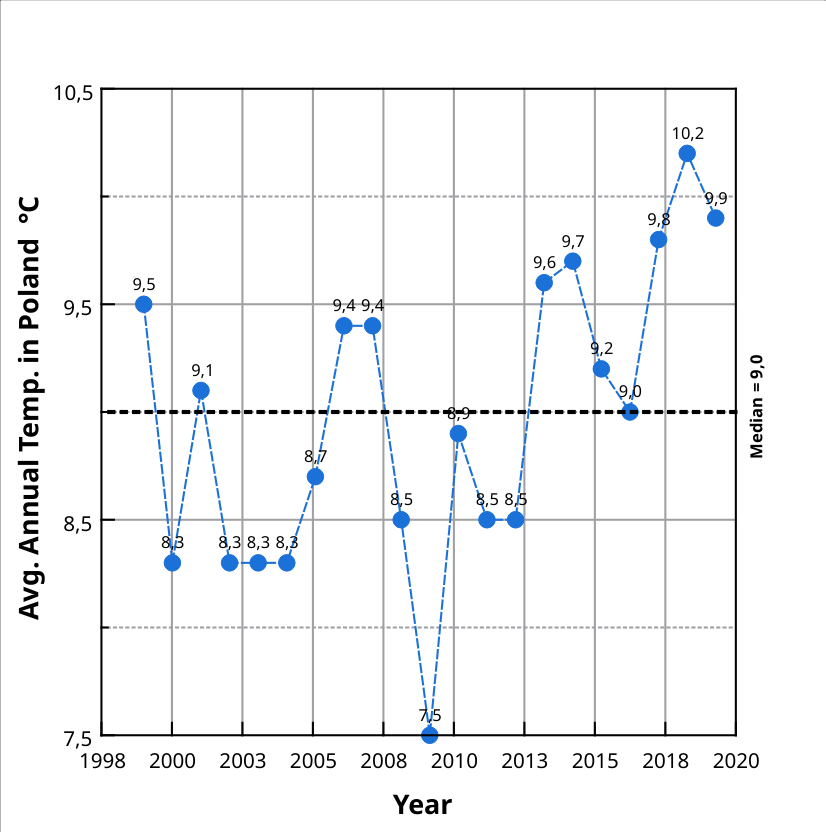
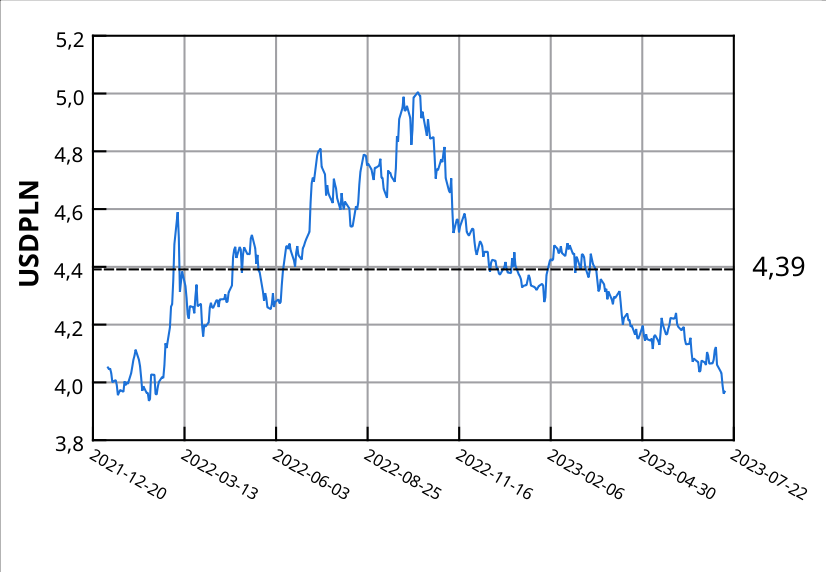
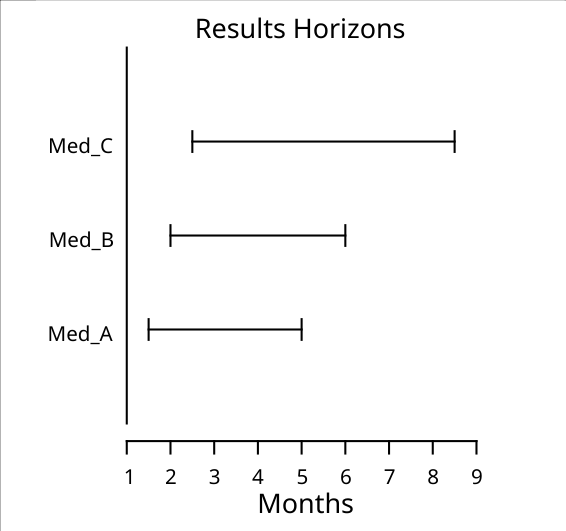
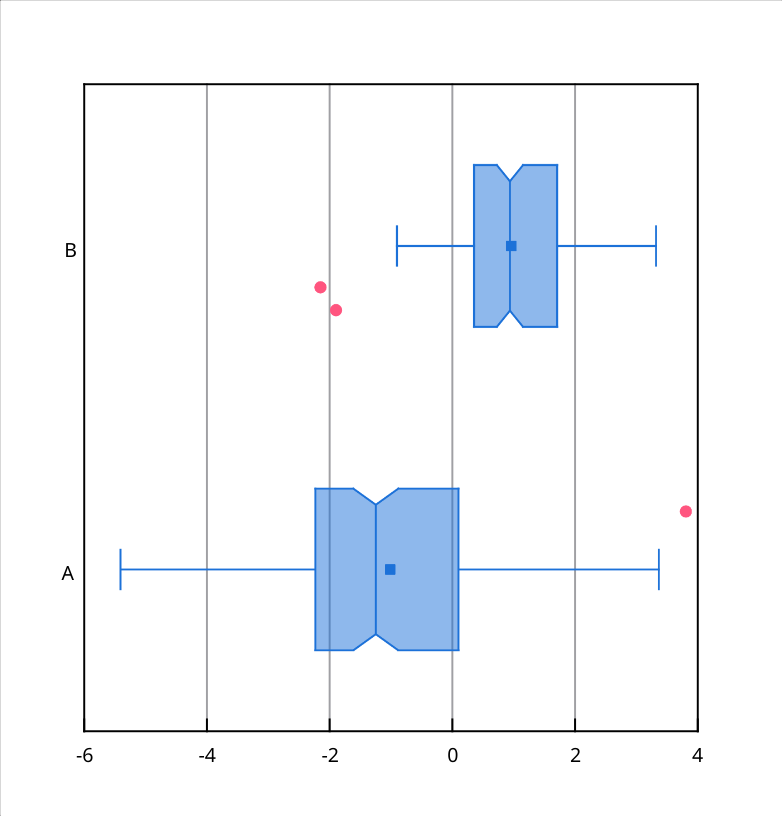
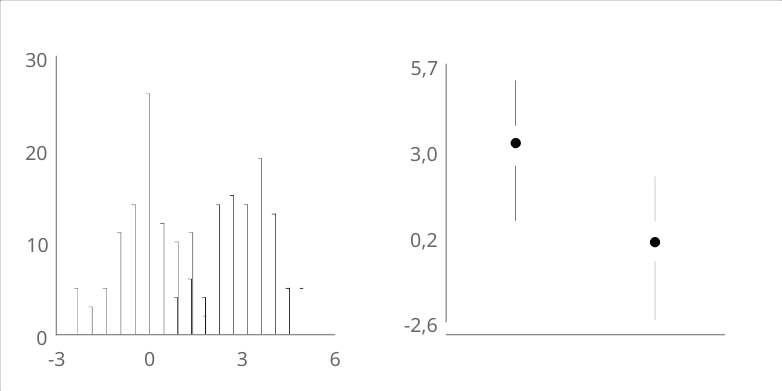
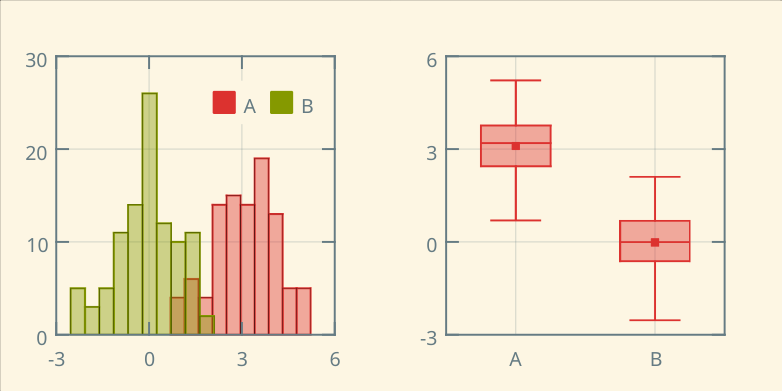
Deviation
Shows how much difference is between a numerical metric and a reference metric.
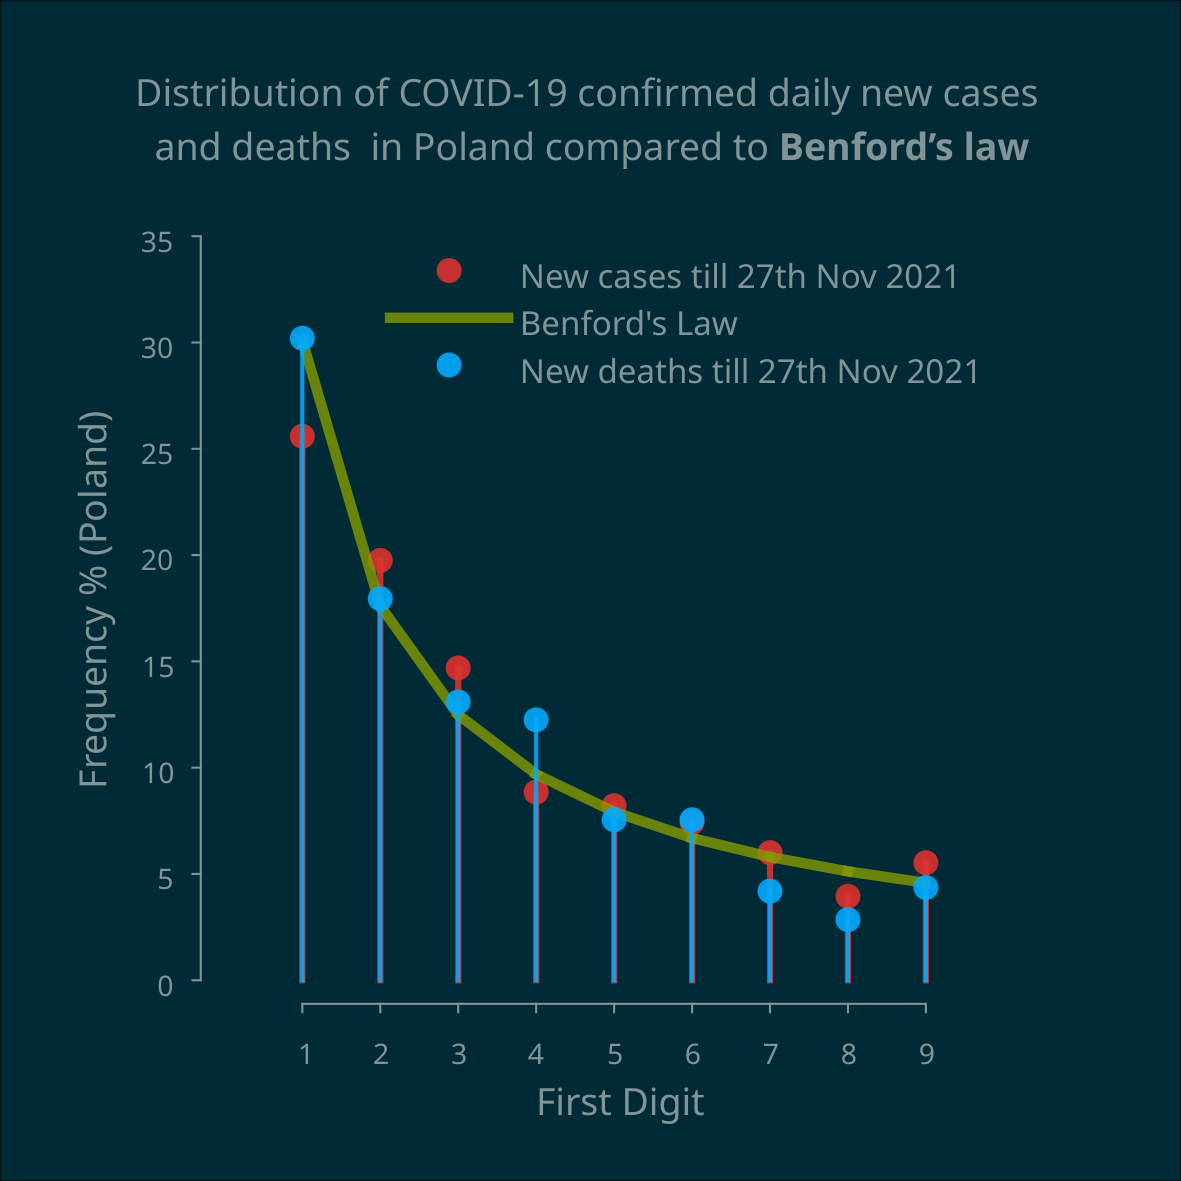
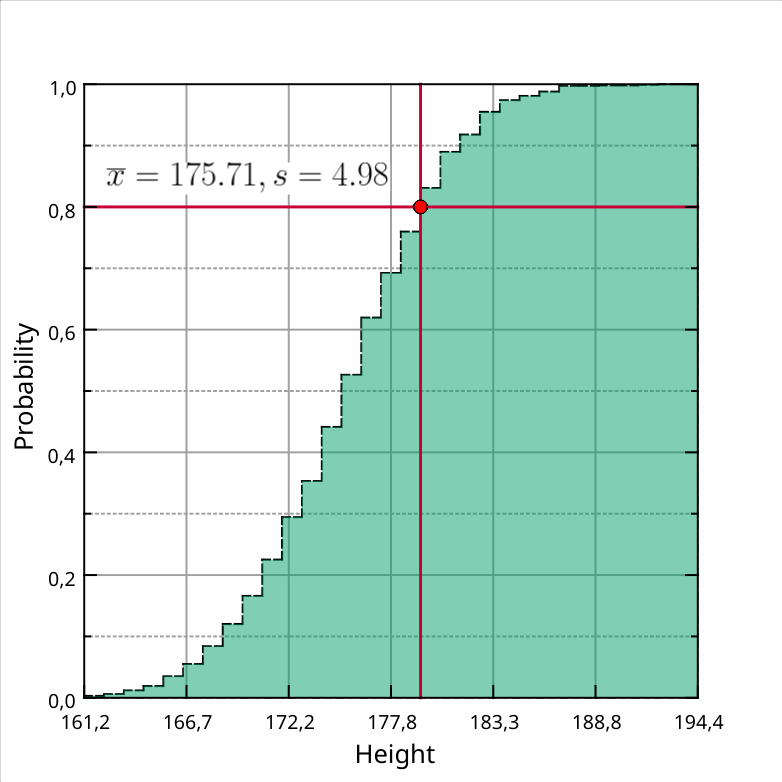
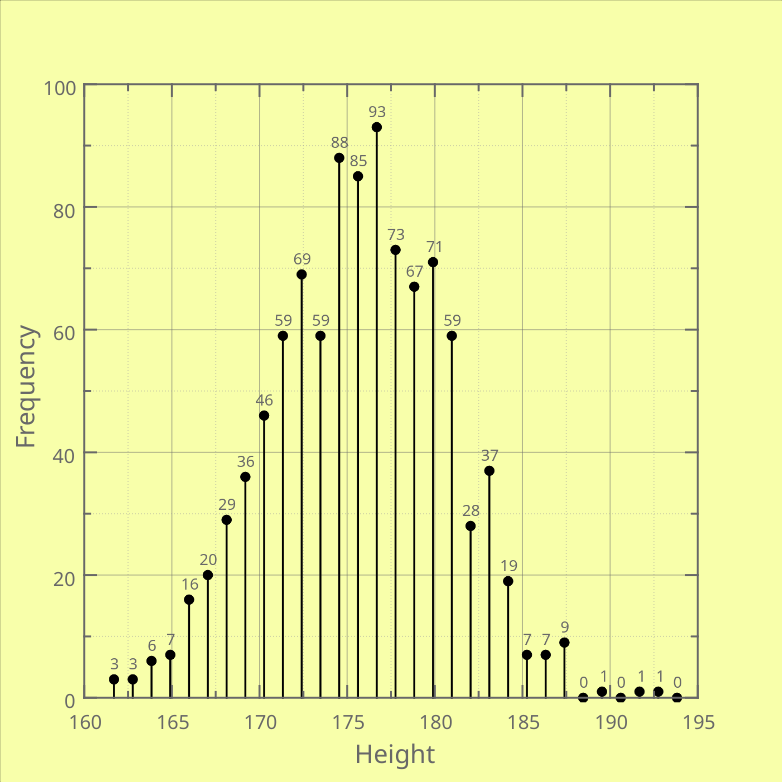
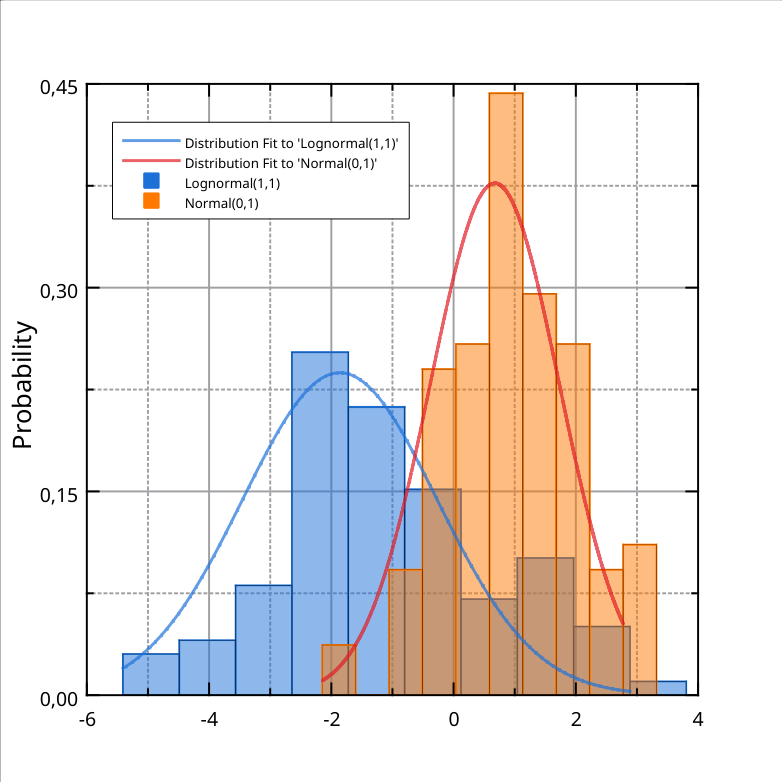
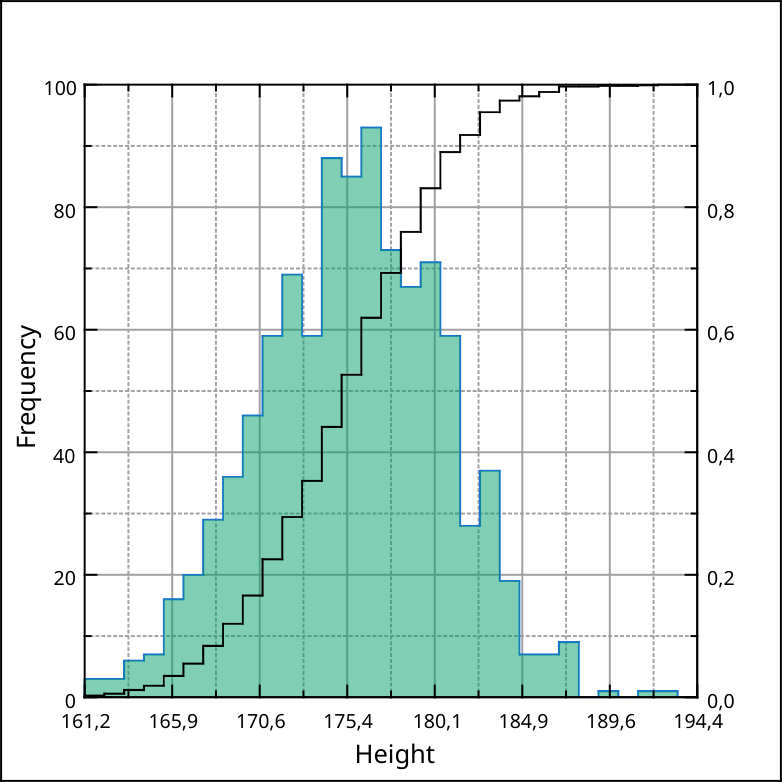
Frequency Distribution
Represents the number of occurrences of different values or categories within a dataset.
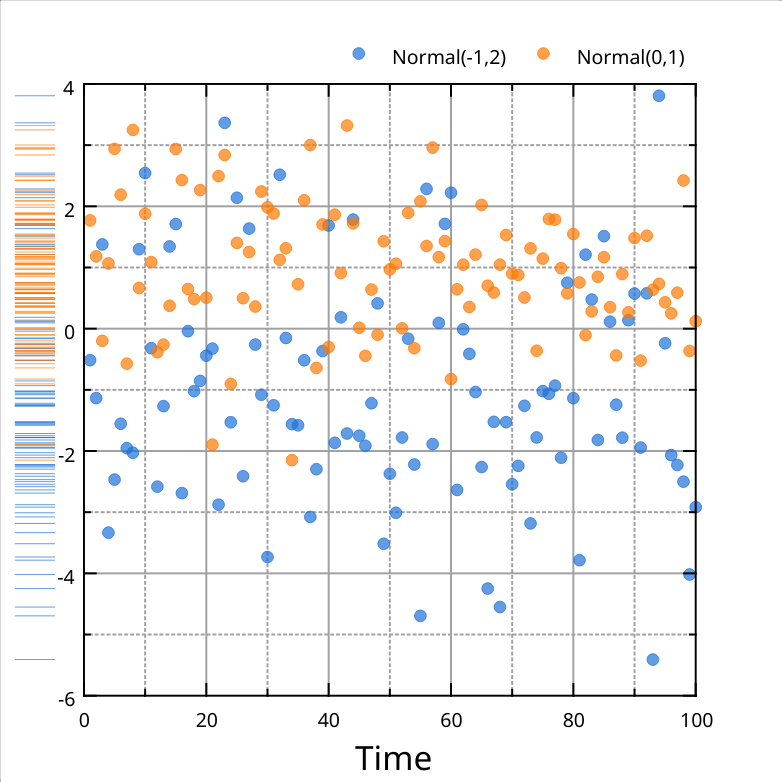
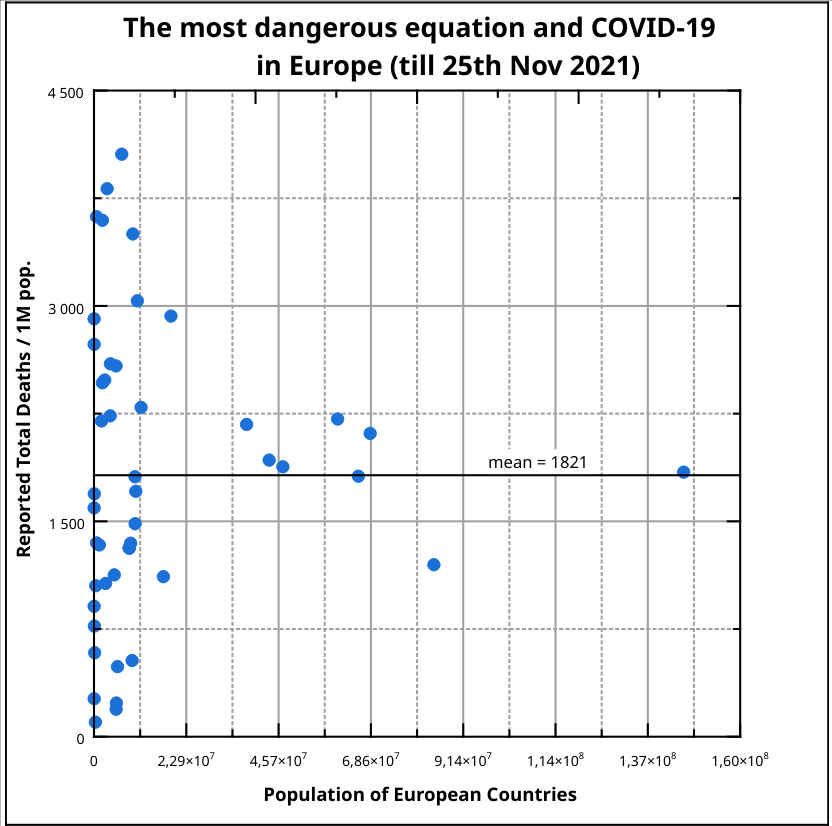
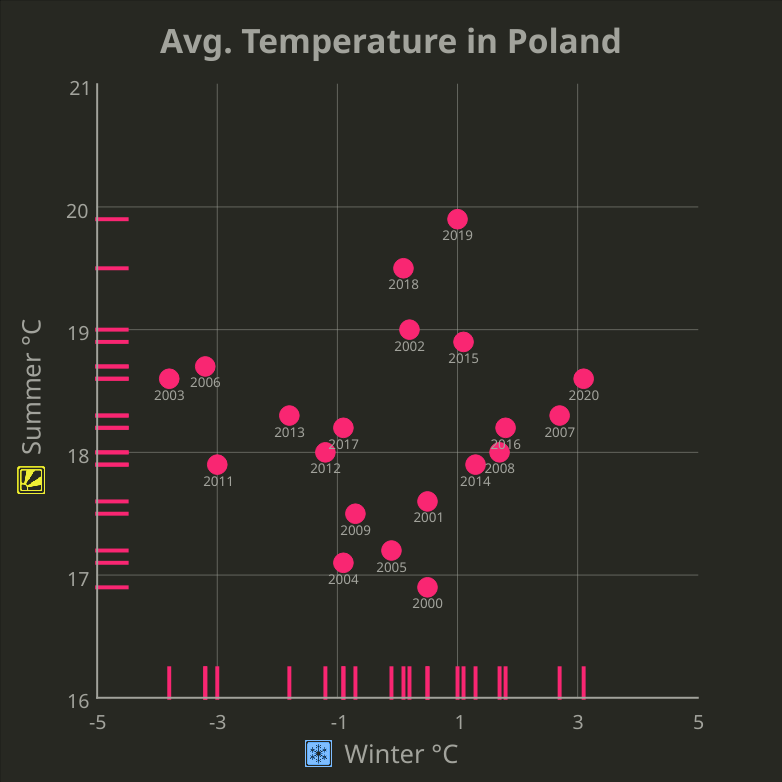
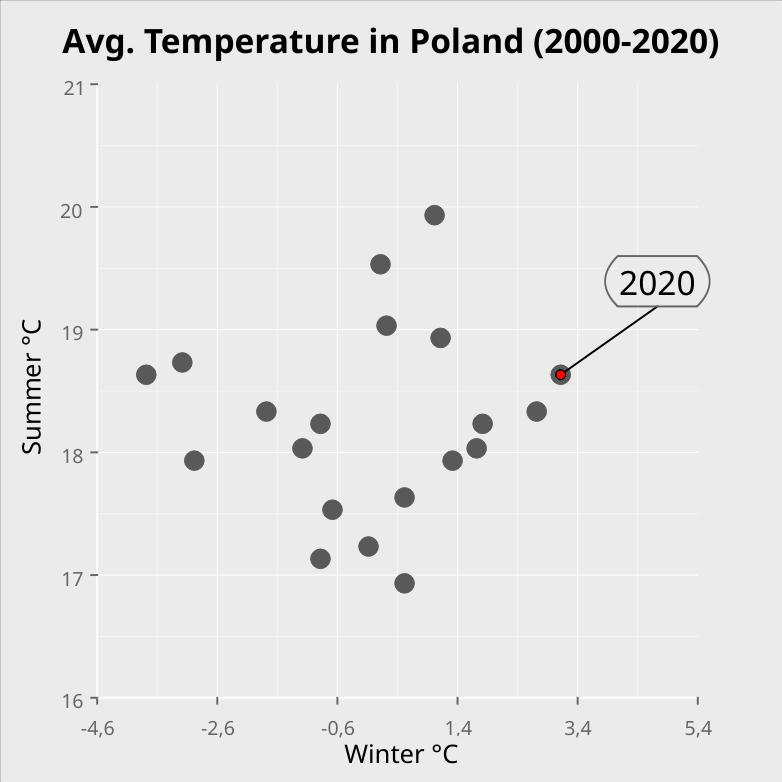
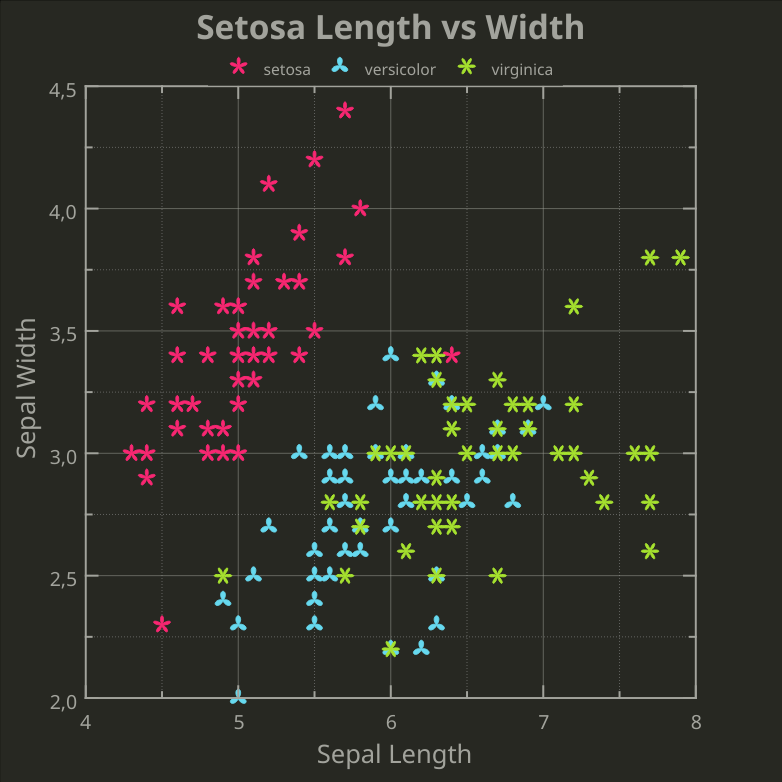
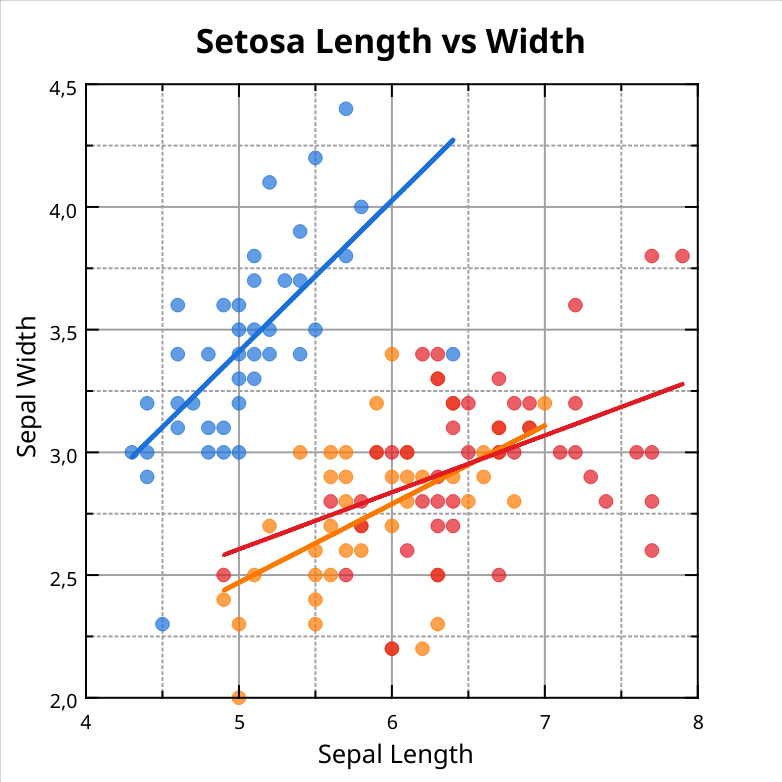
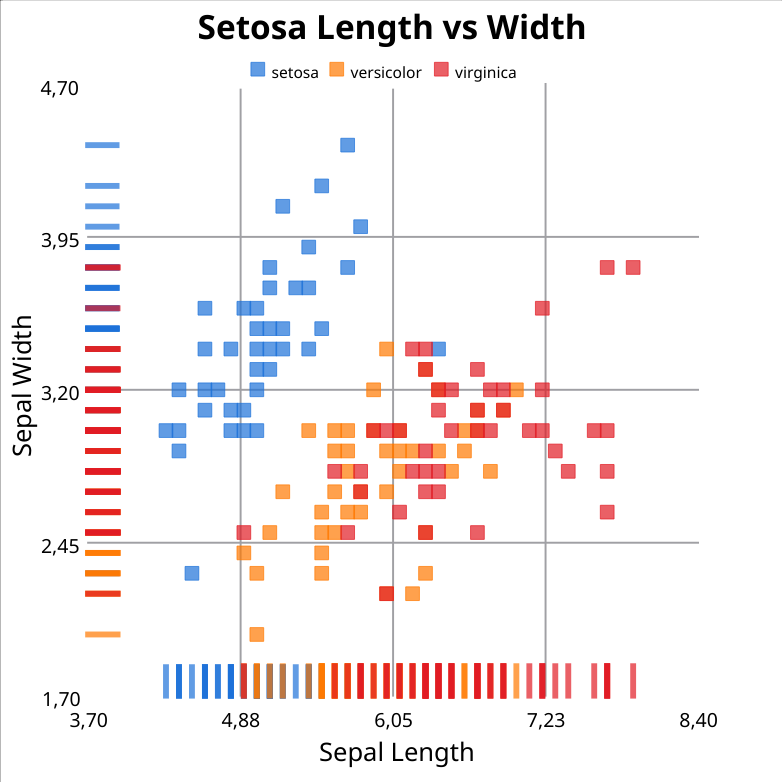
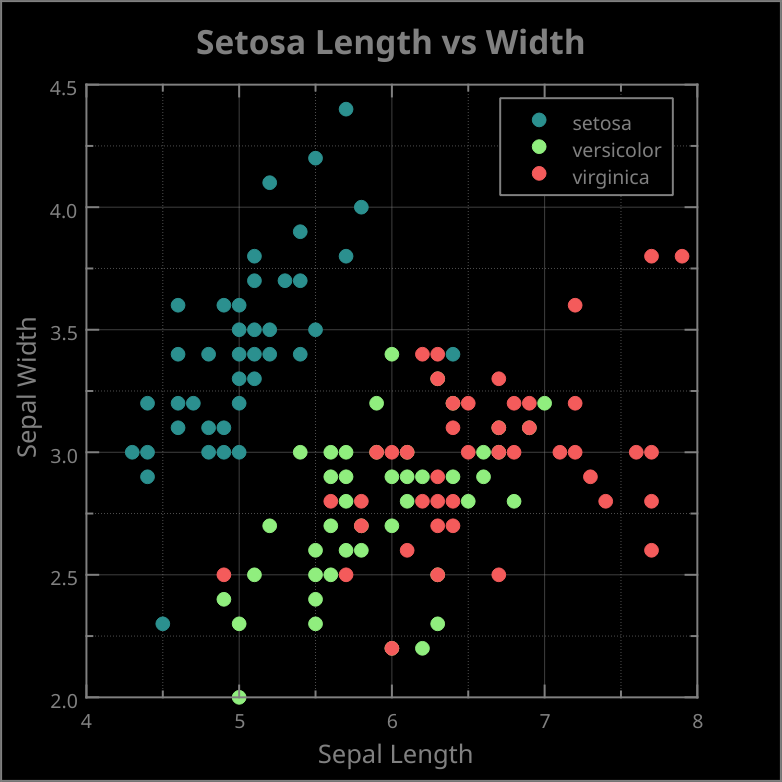
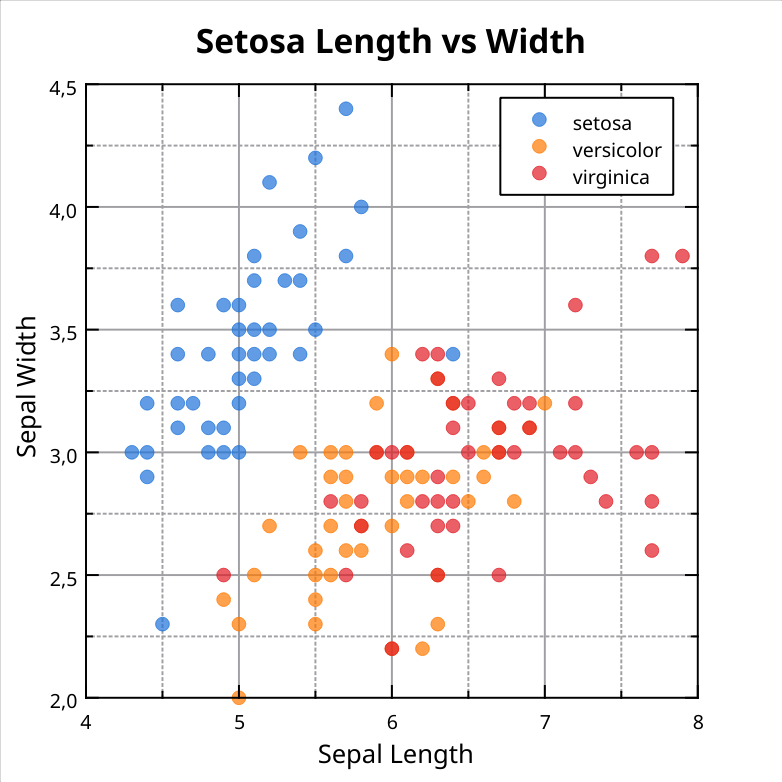
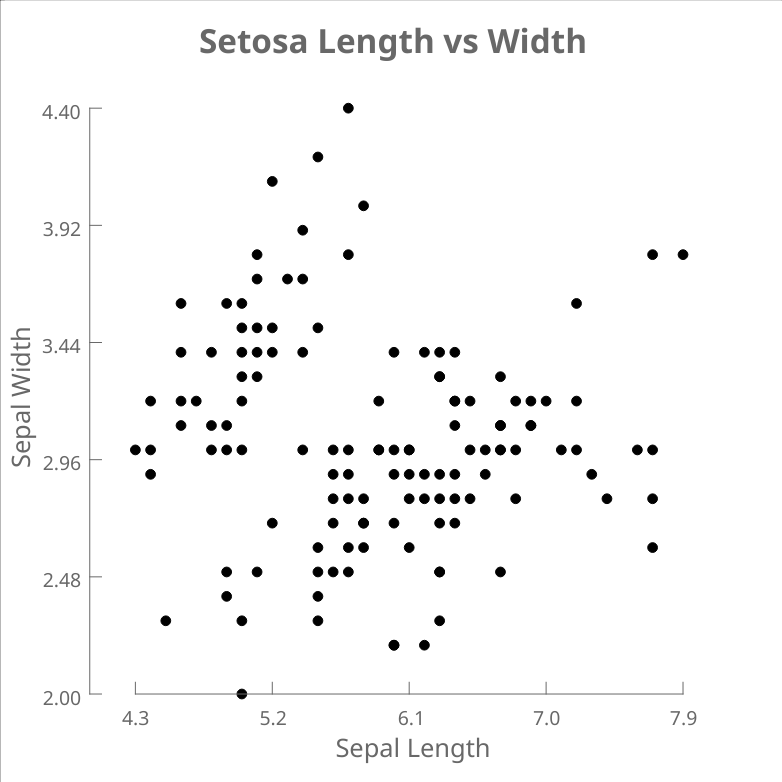
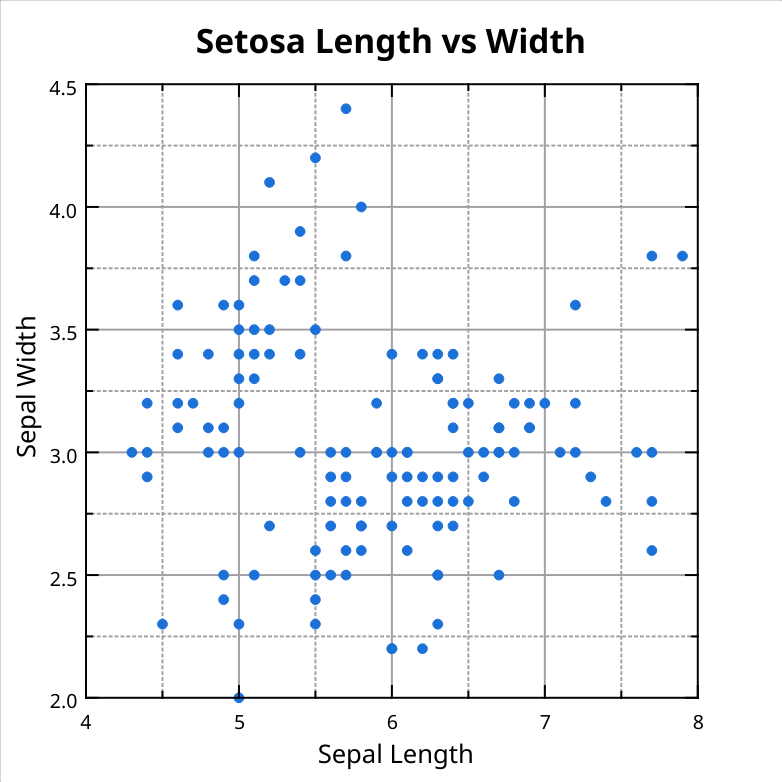
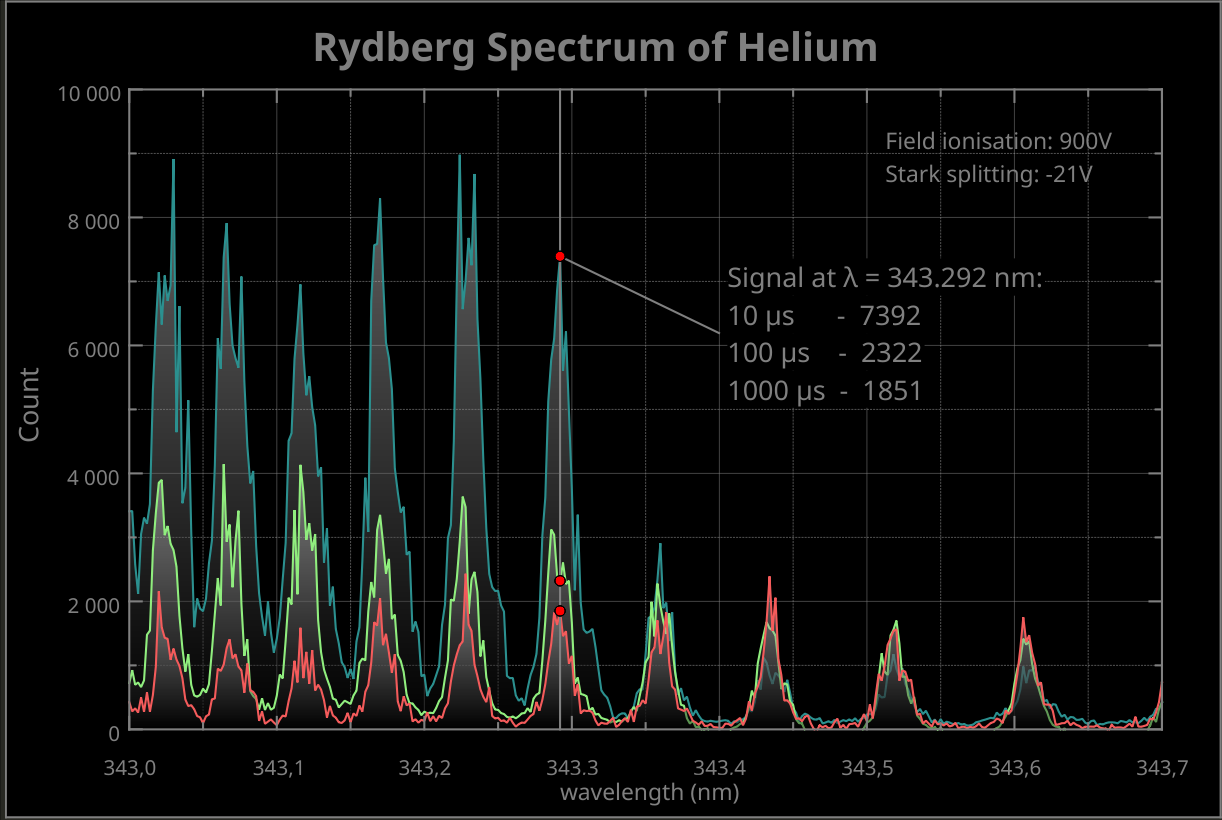
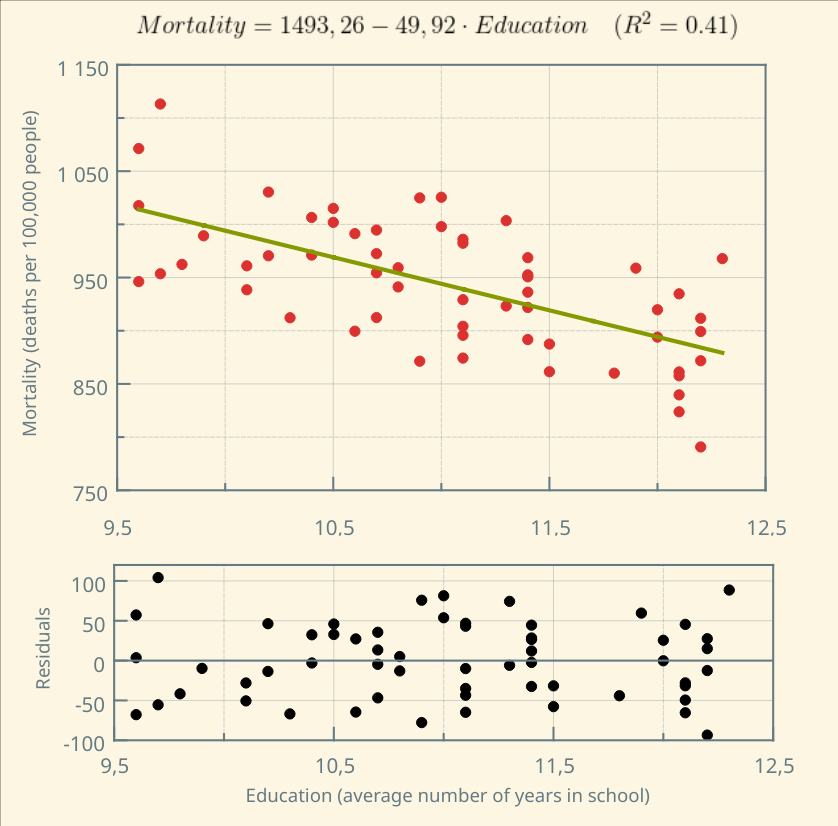
Correlation
Demonstrates if variables exhibit potential positive or negative correlation to each other.