LabPlot
FREE, open source and cross-platform Data Visualization and Analysis software accessible to everyone and trusted by professionals
Feature Highlights
Discover what makes LabPlot special
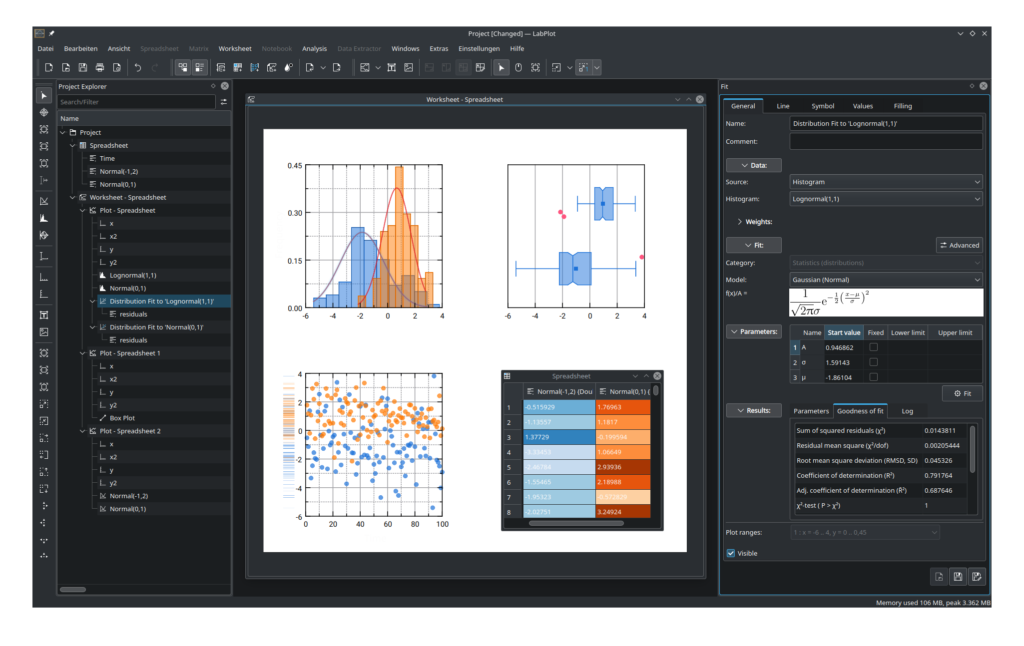
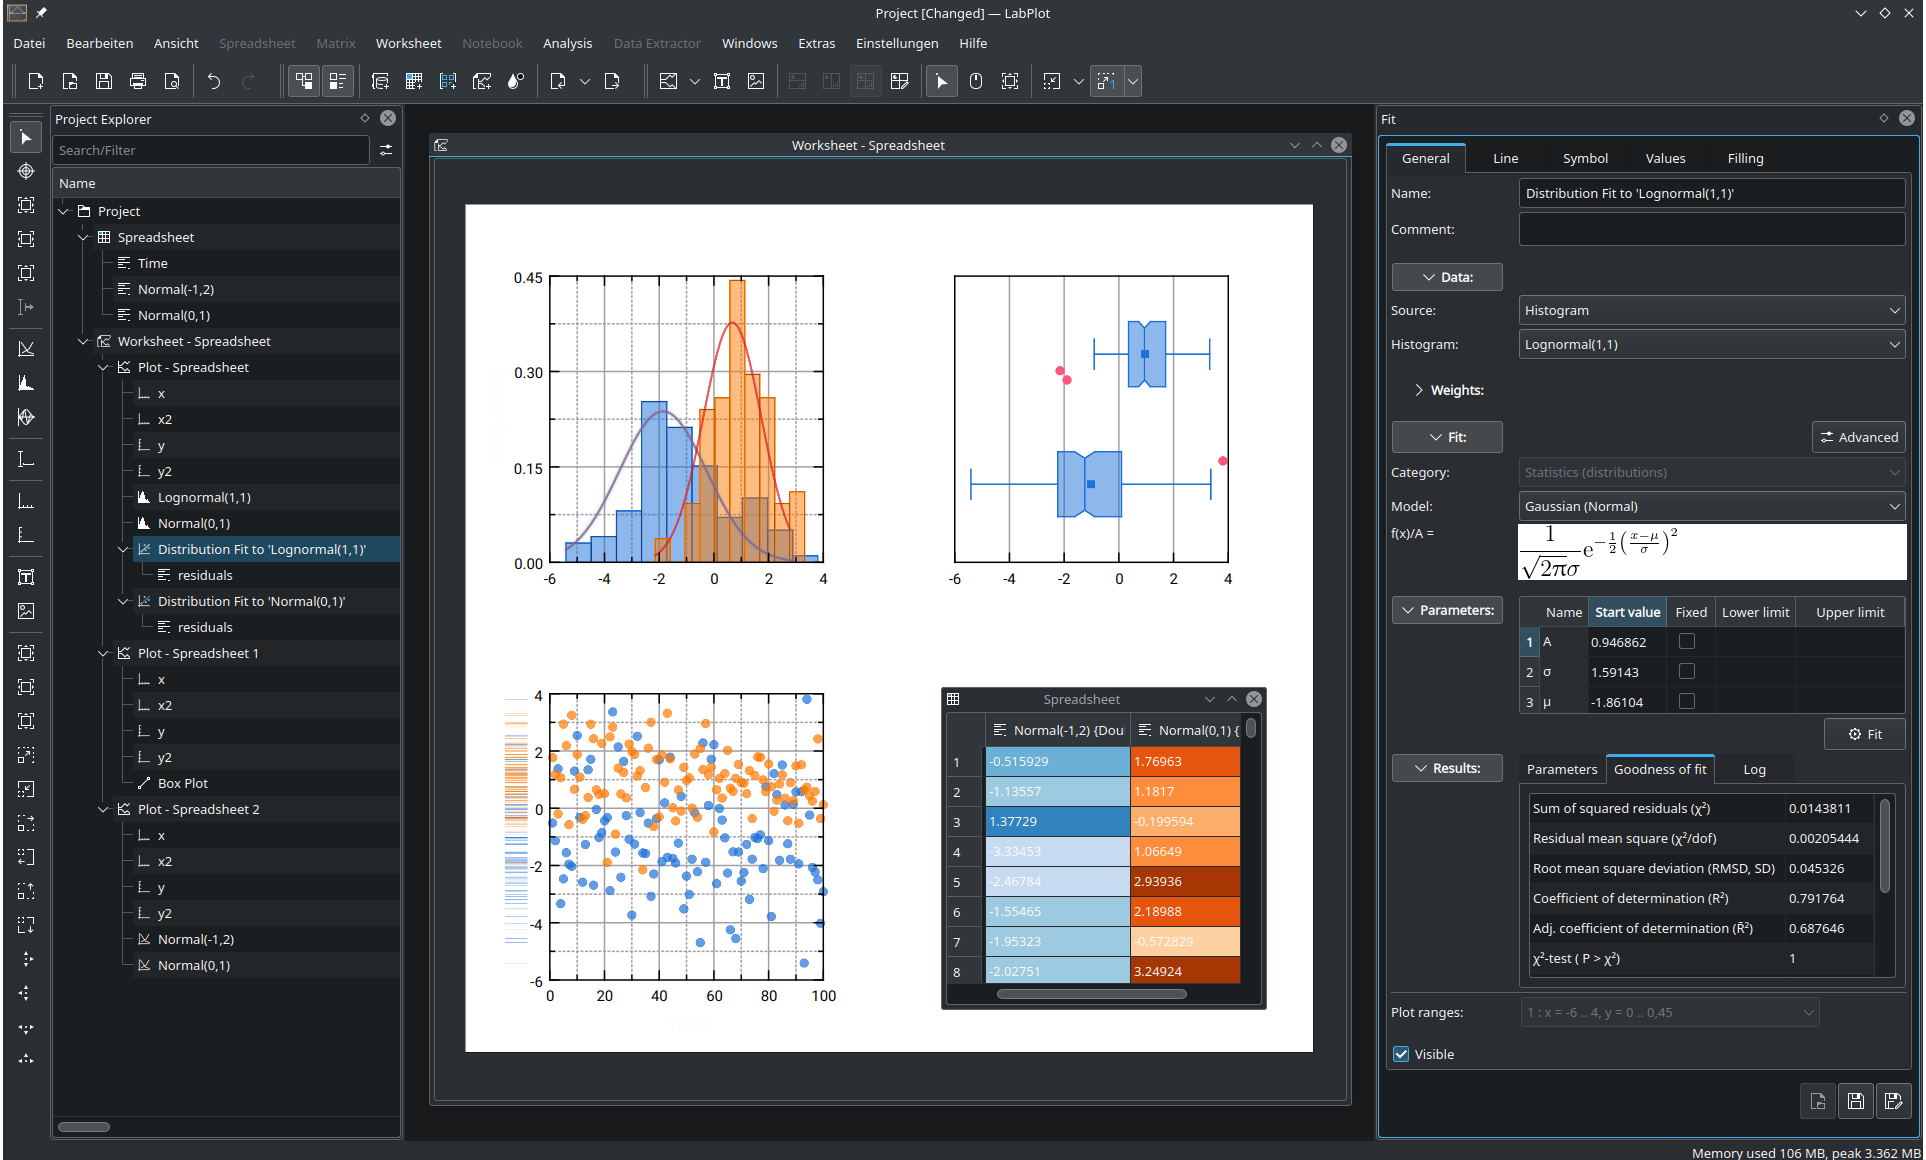
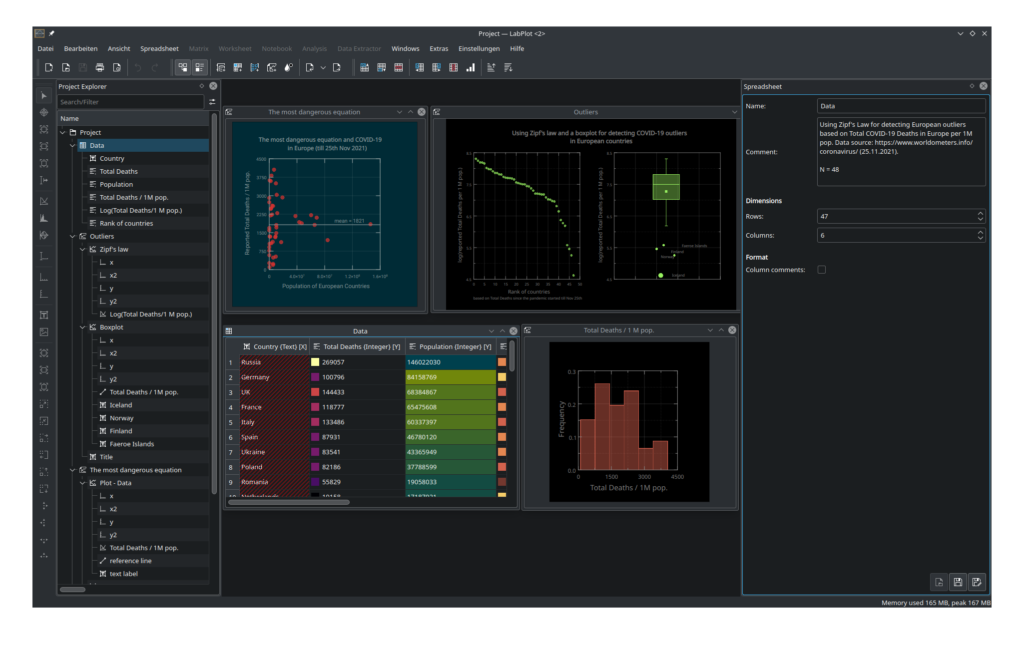
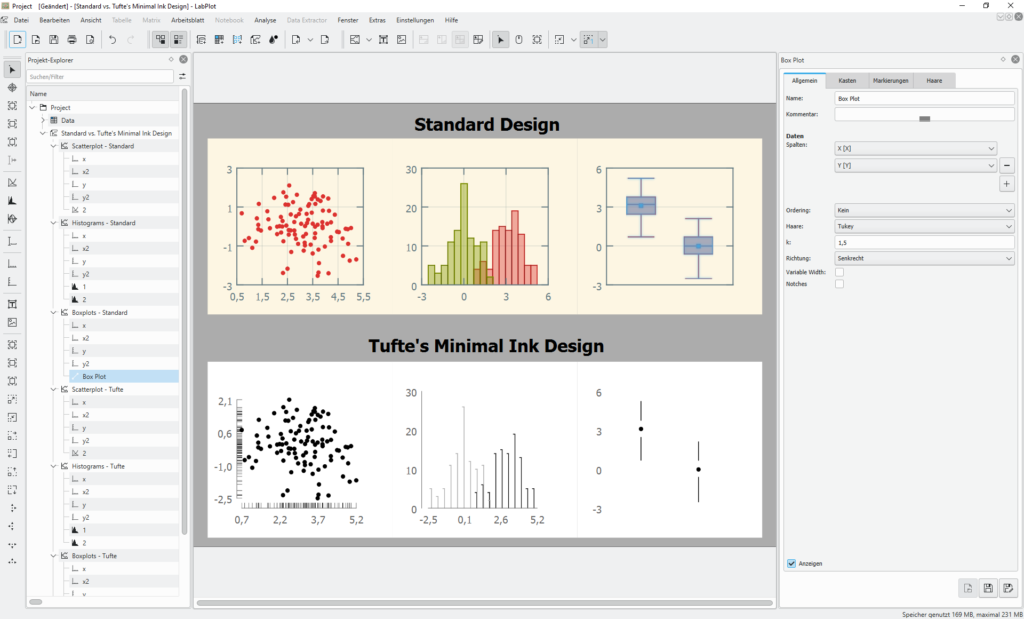
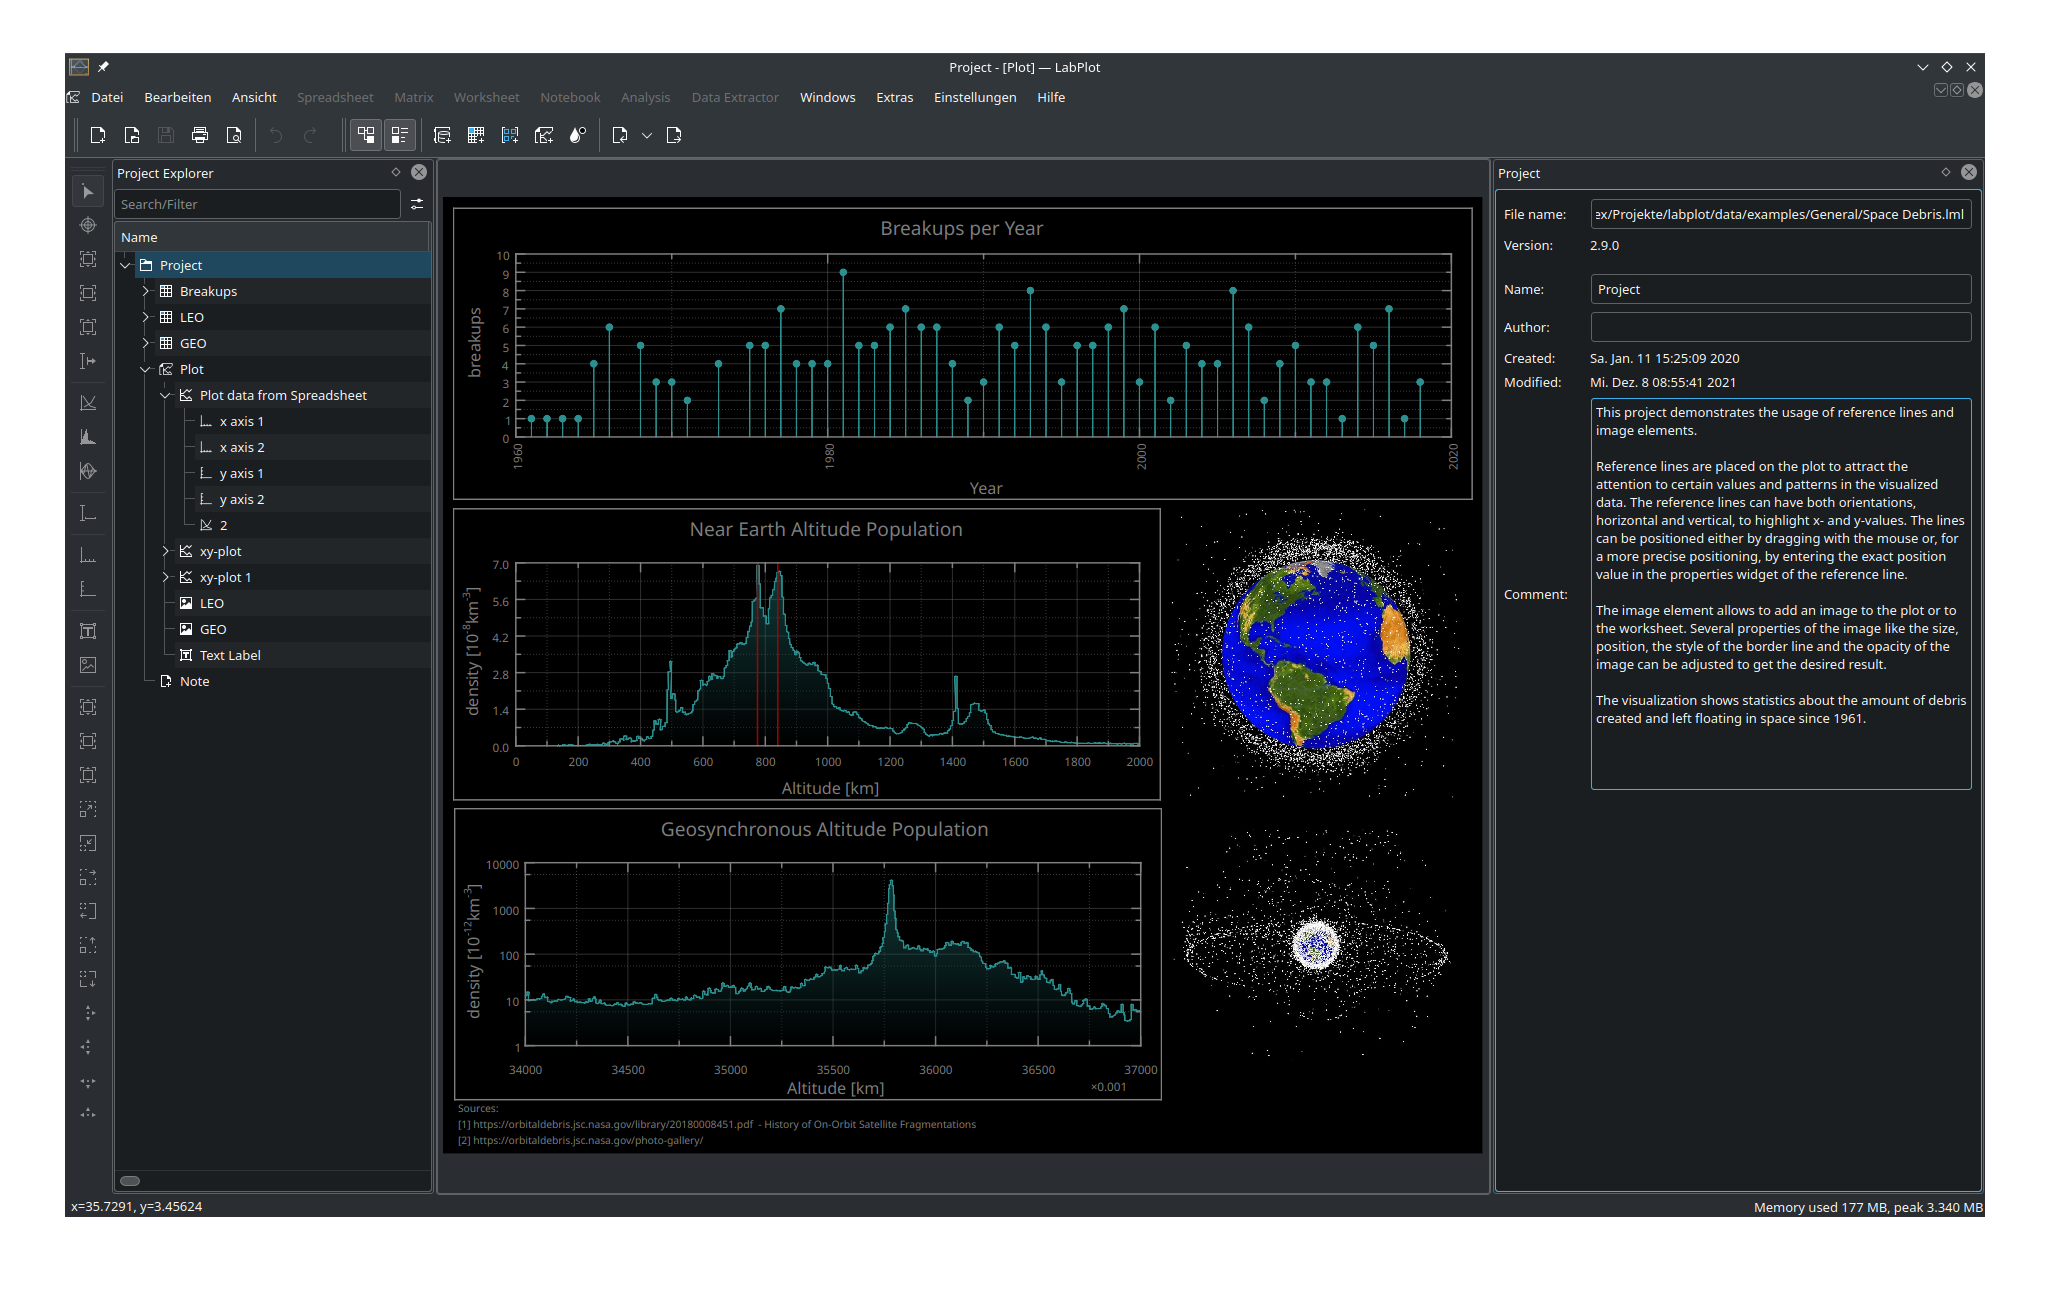
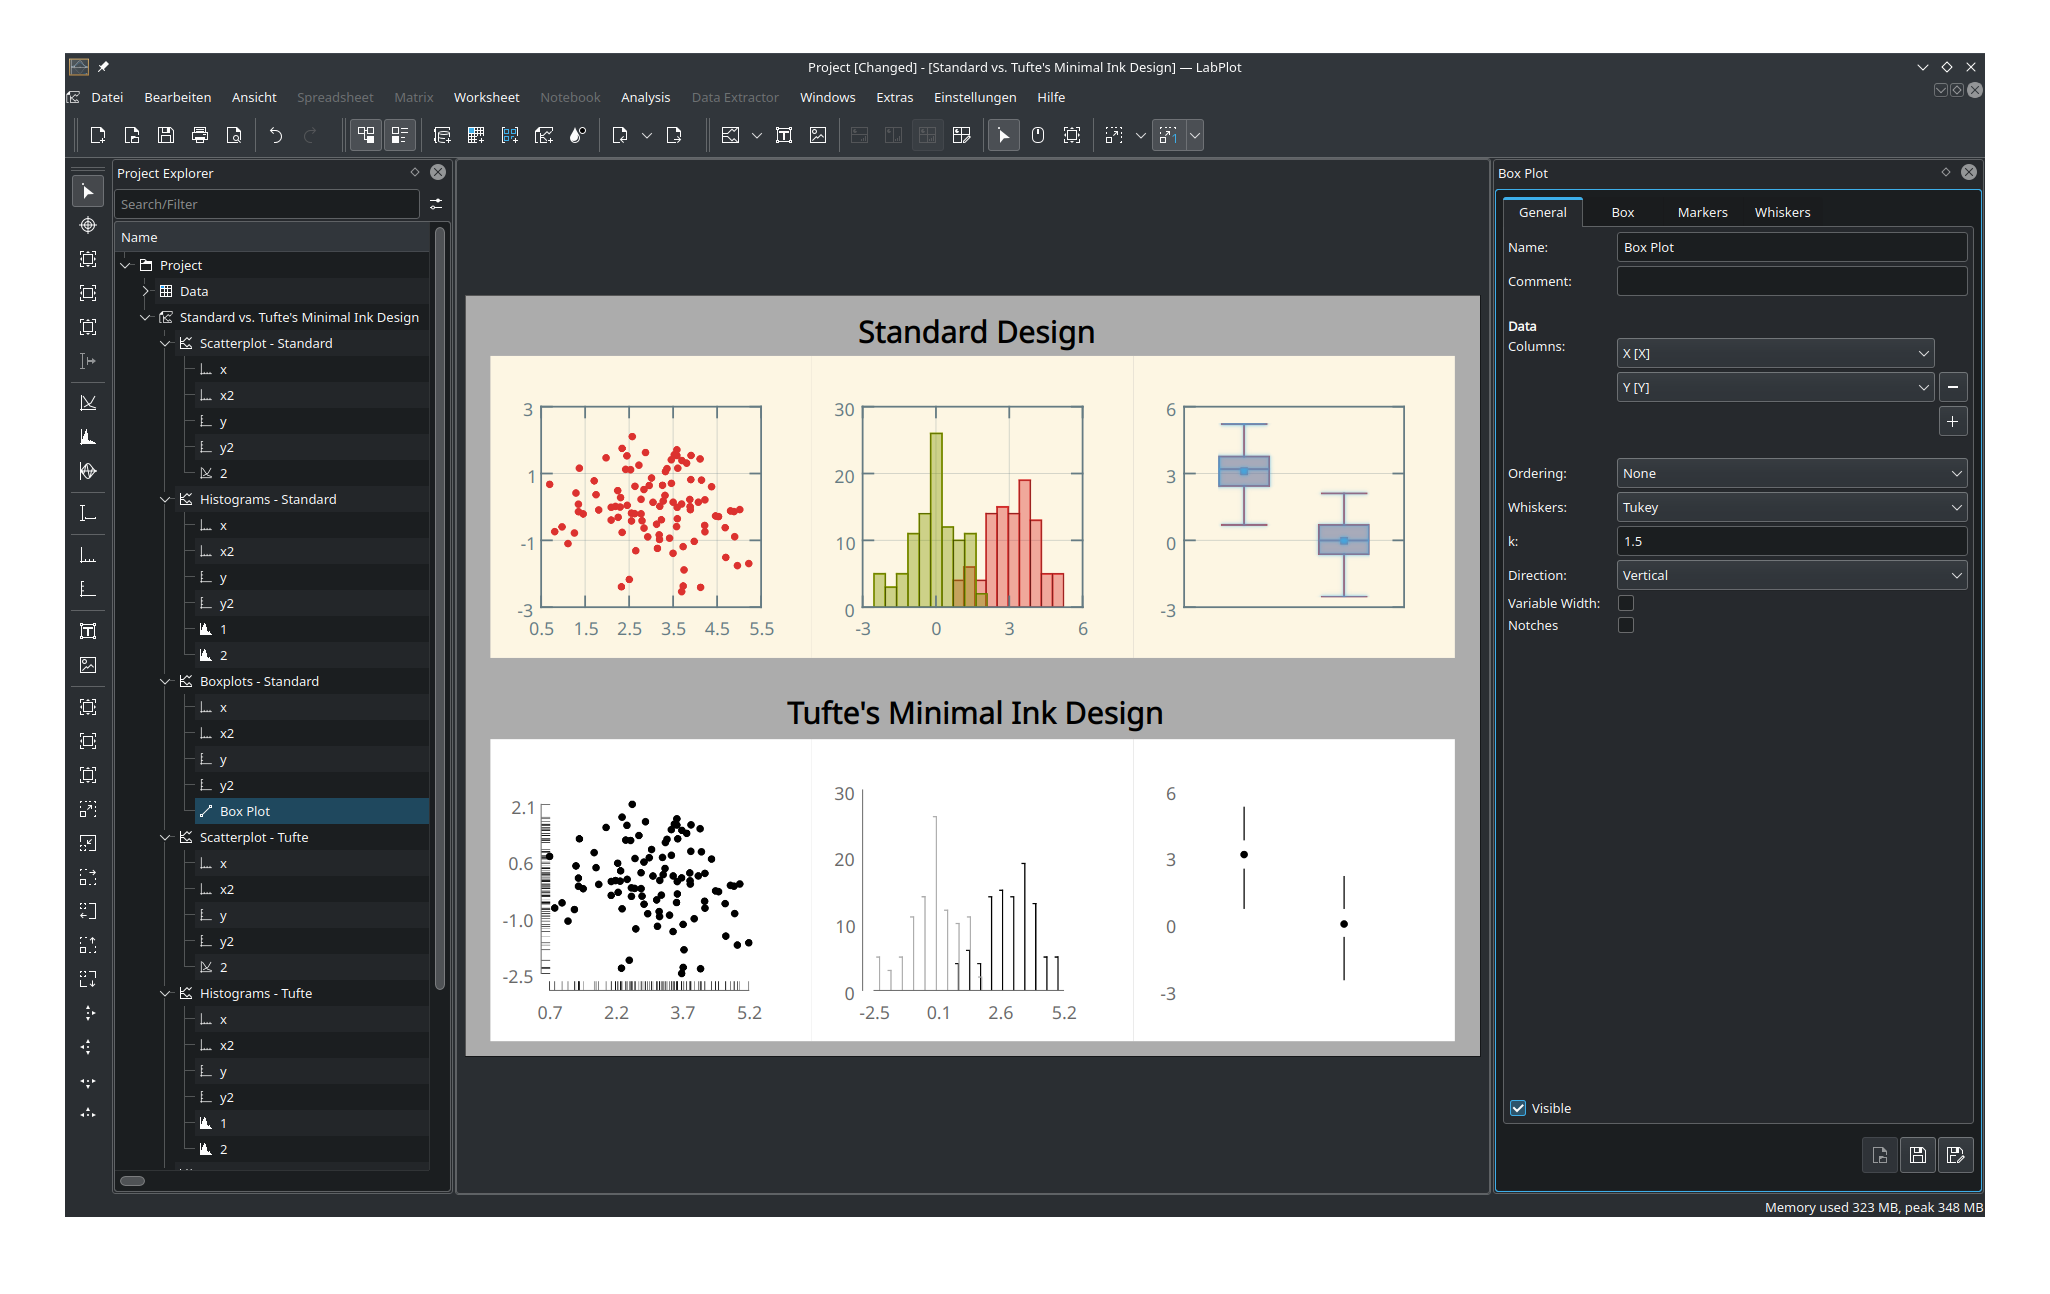
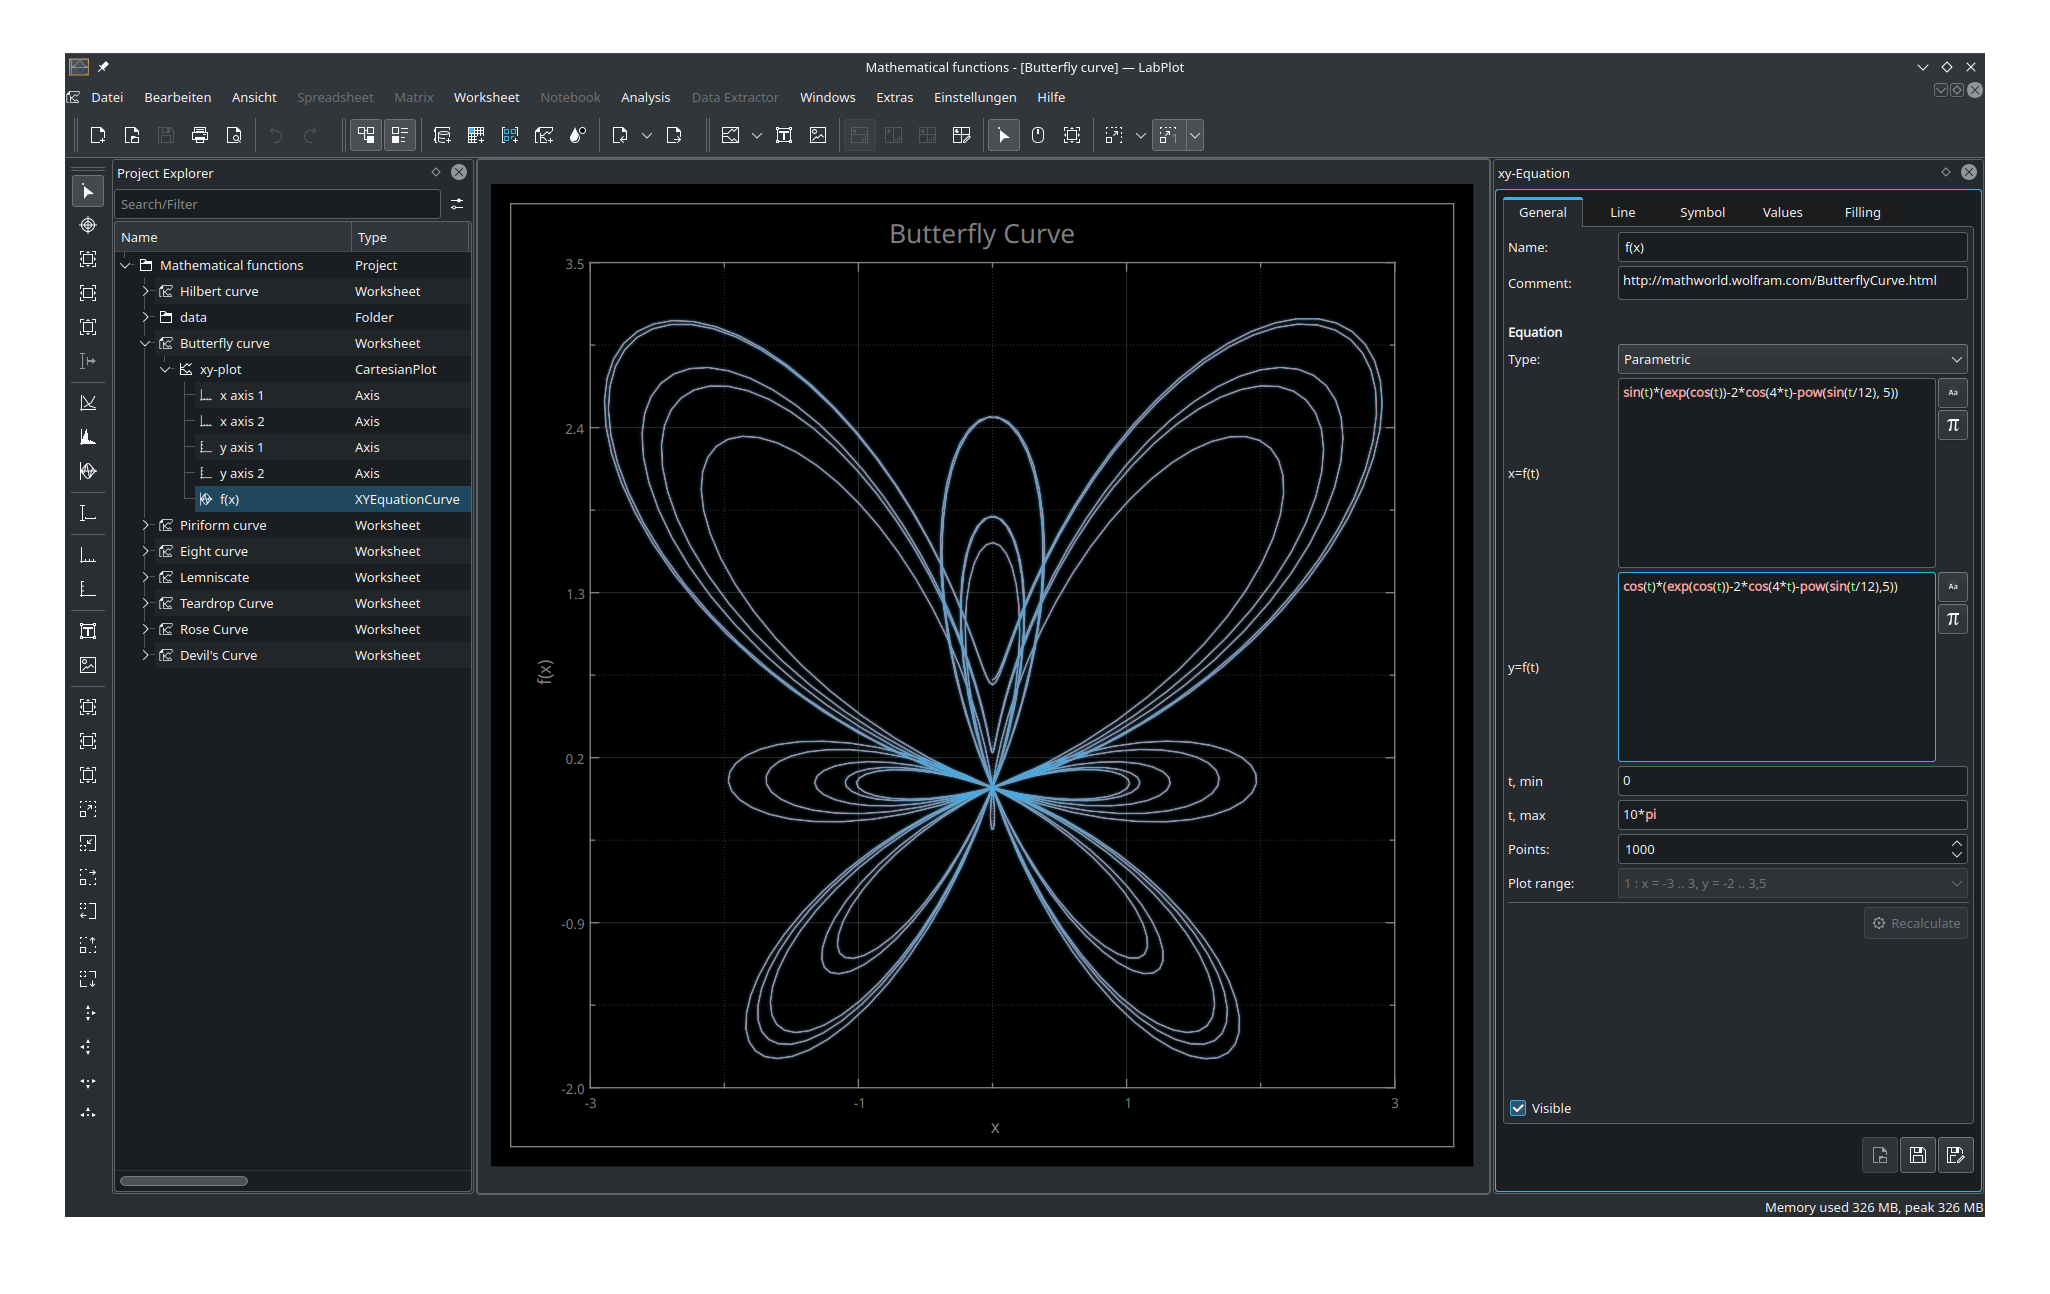
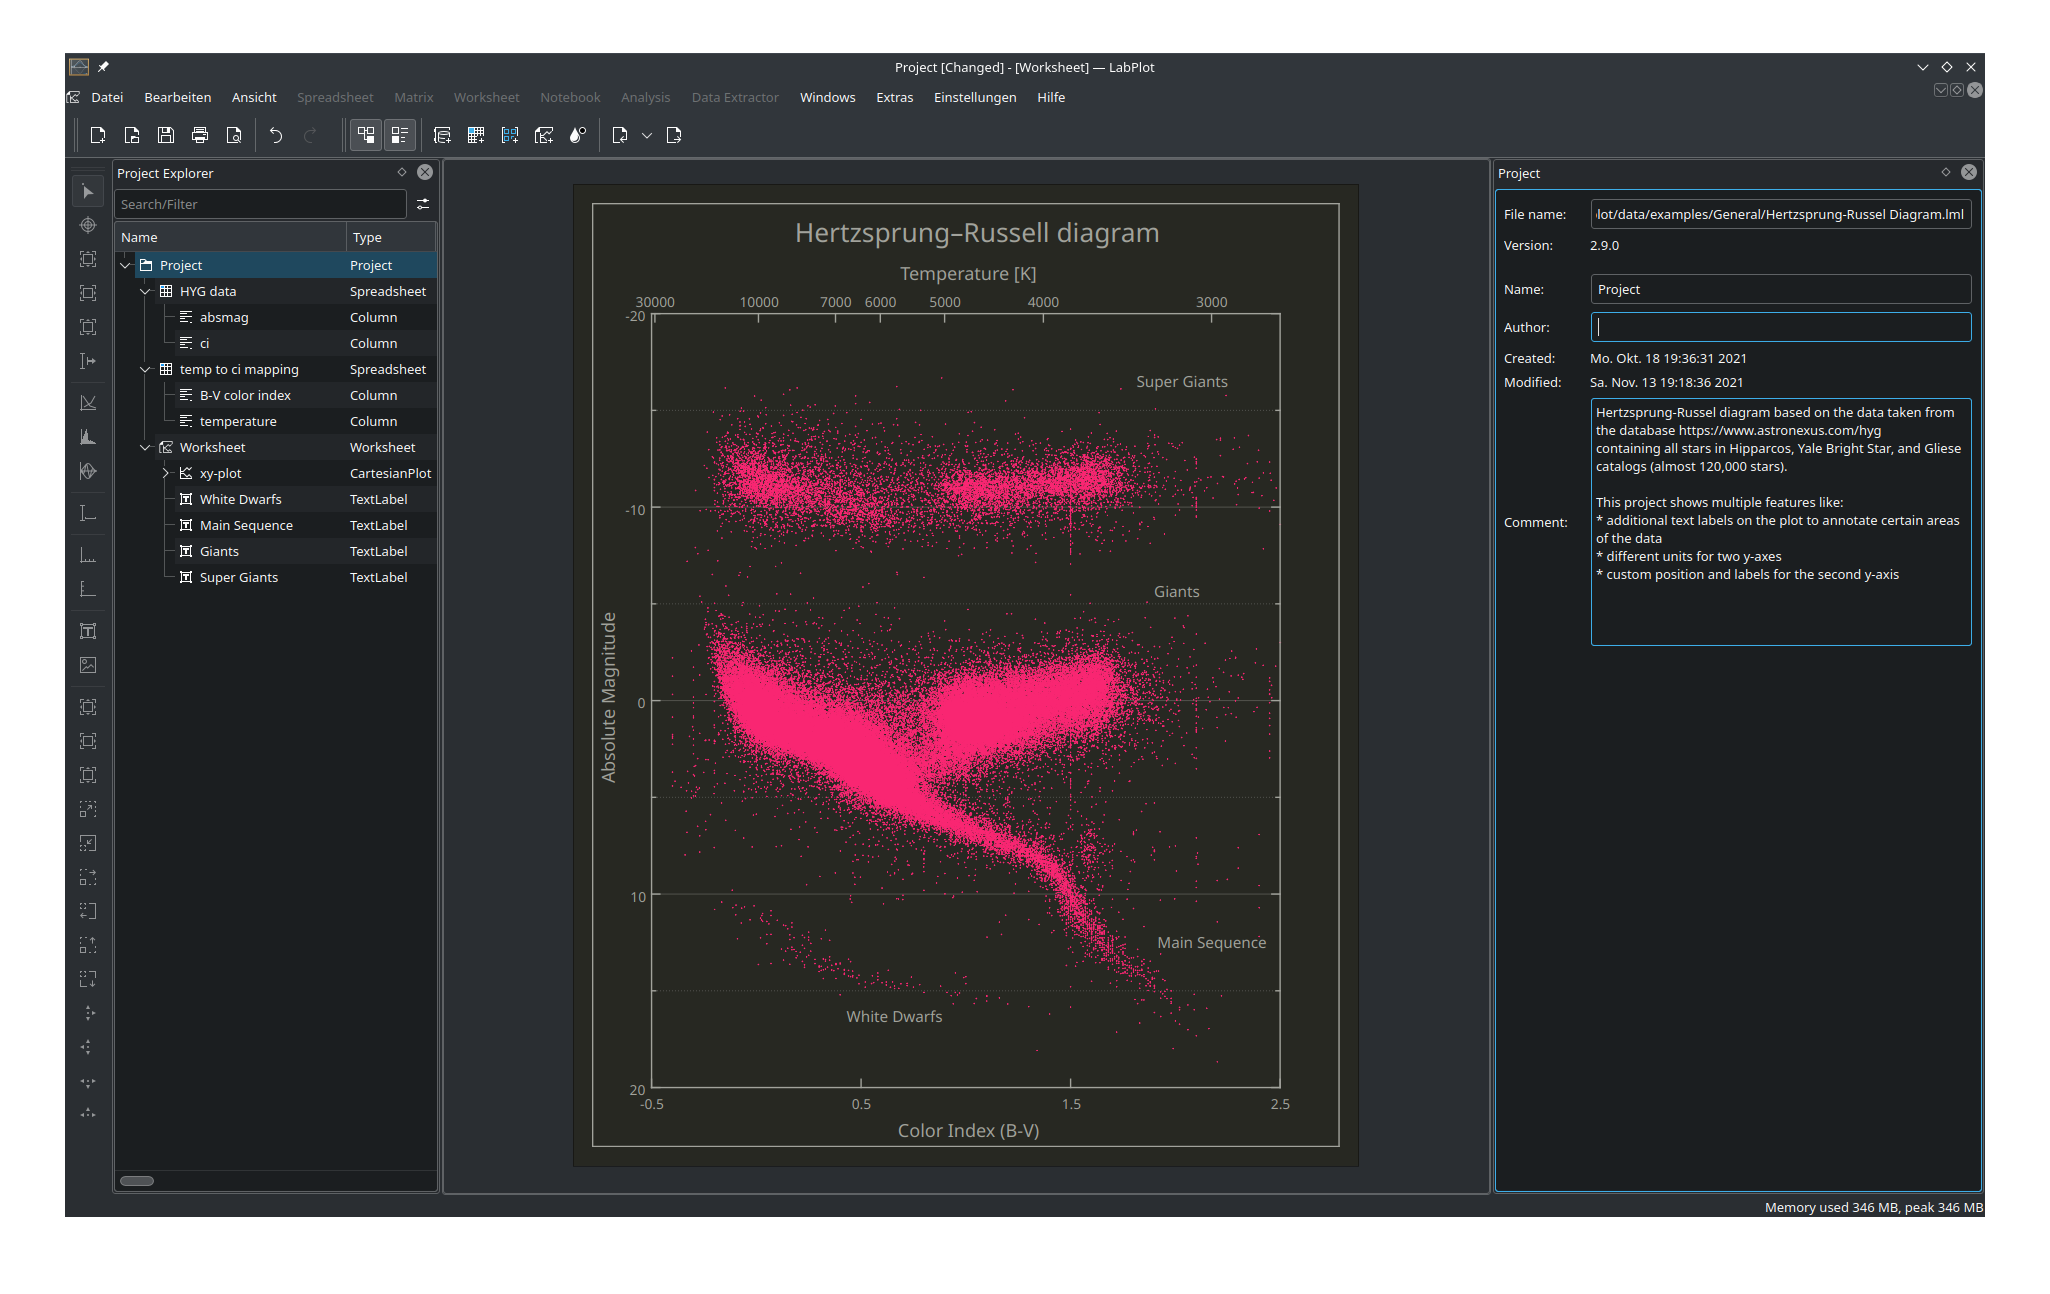
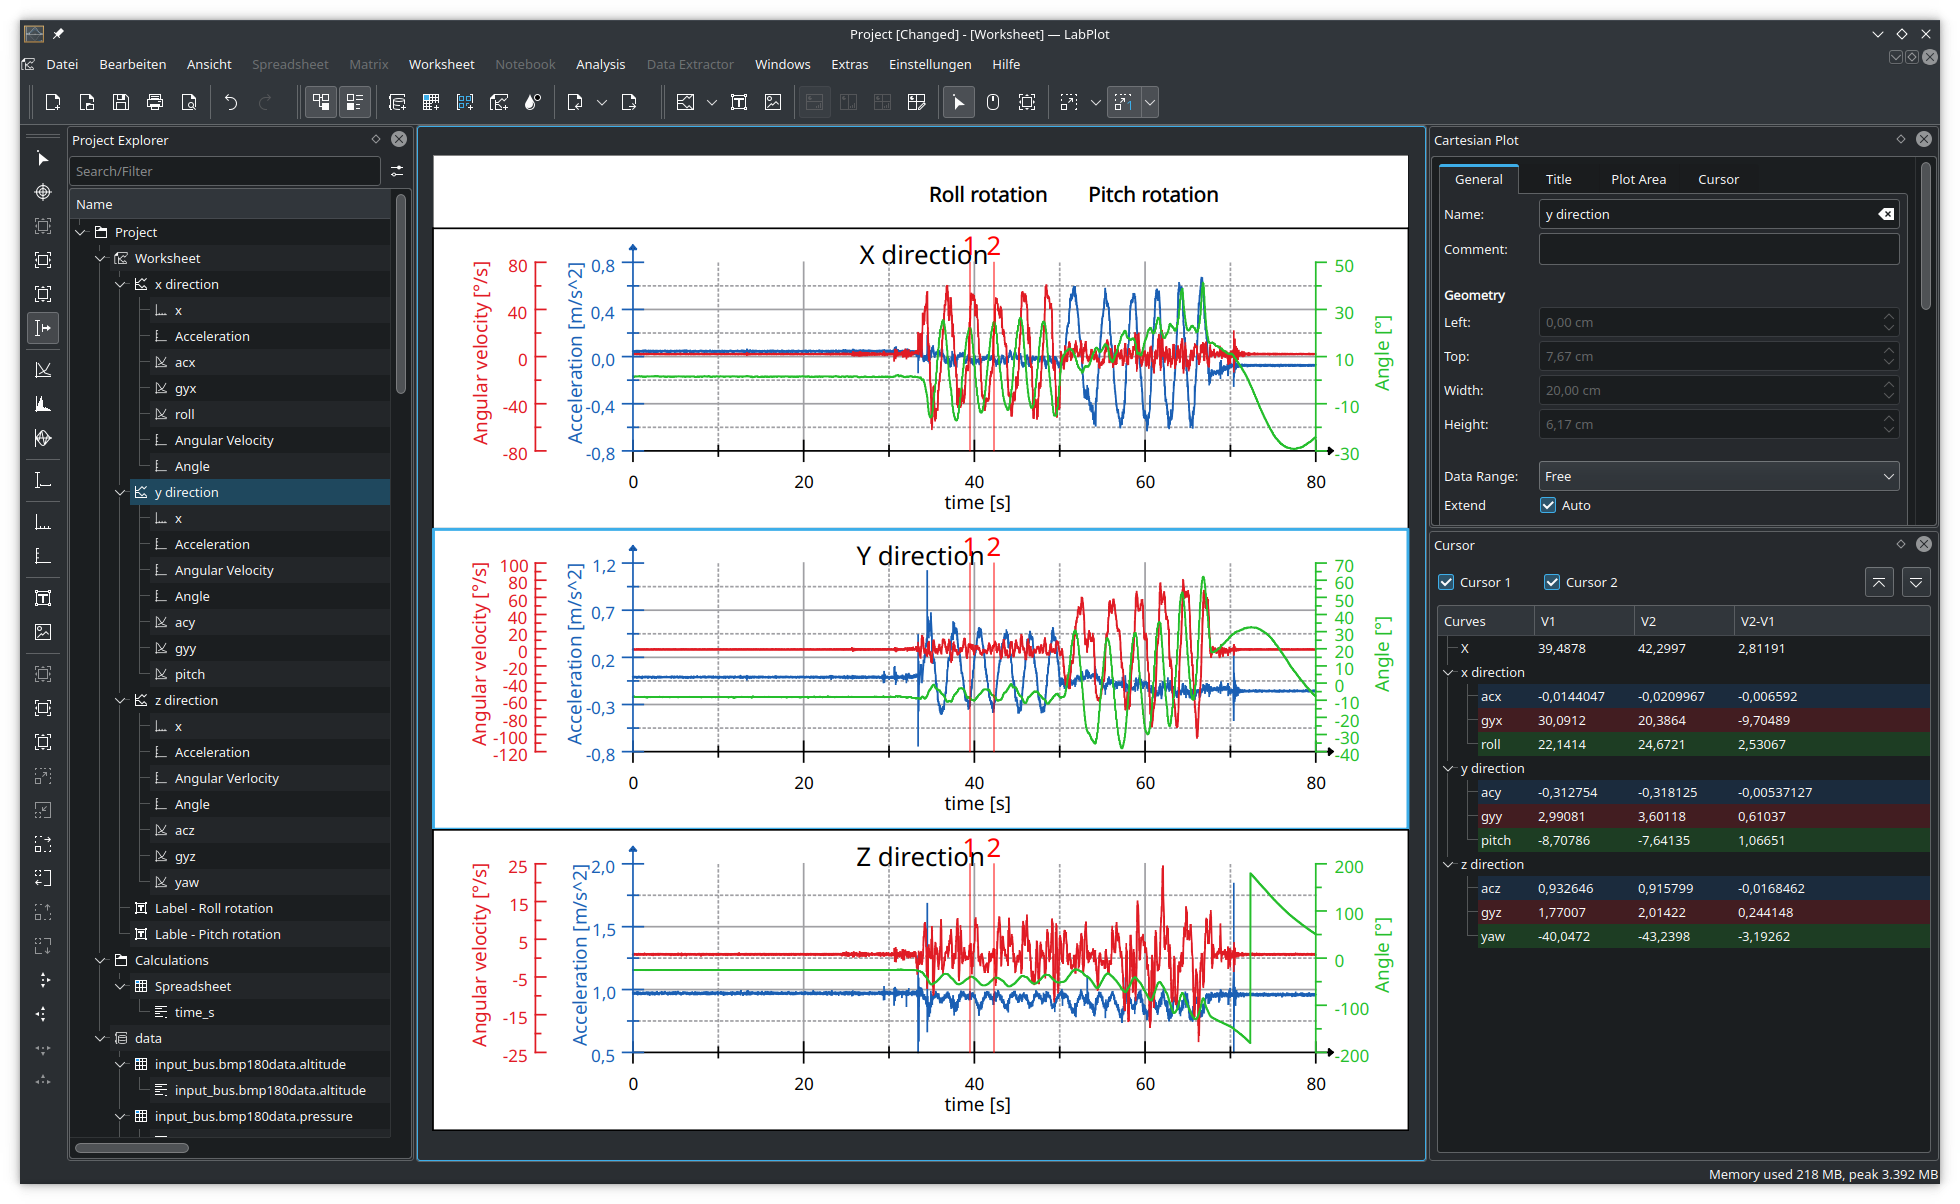
High-quality data visualization and interactive plotting with few clicks
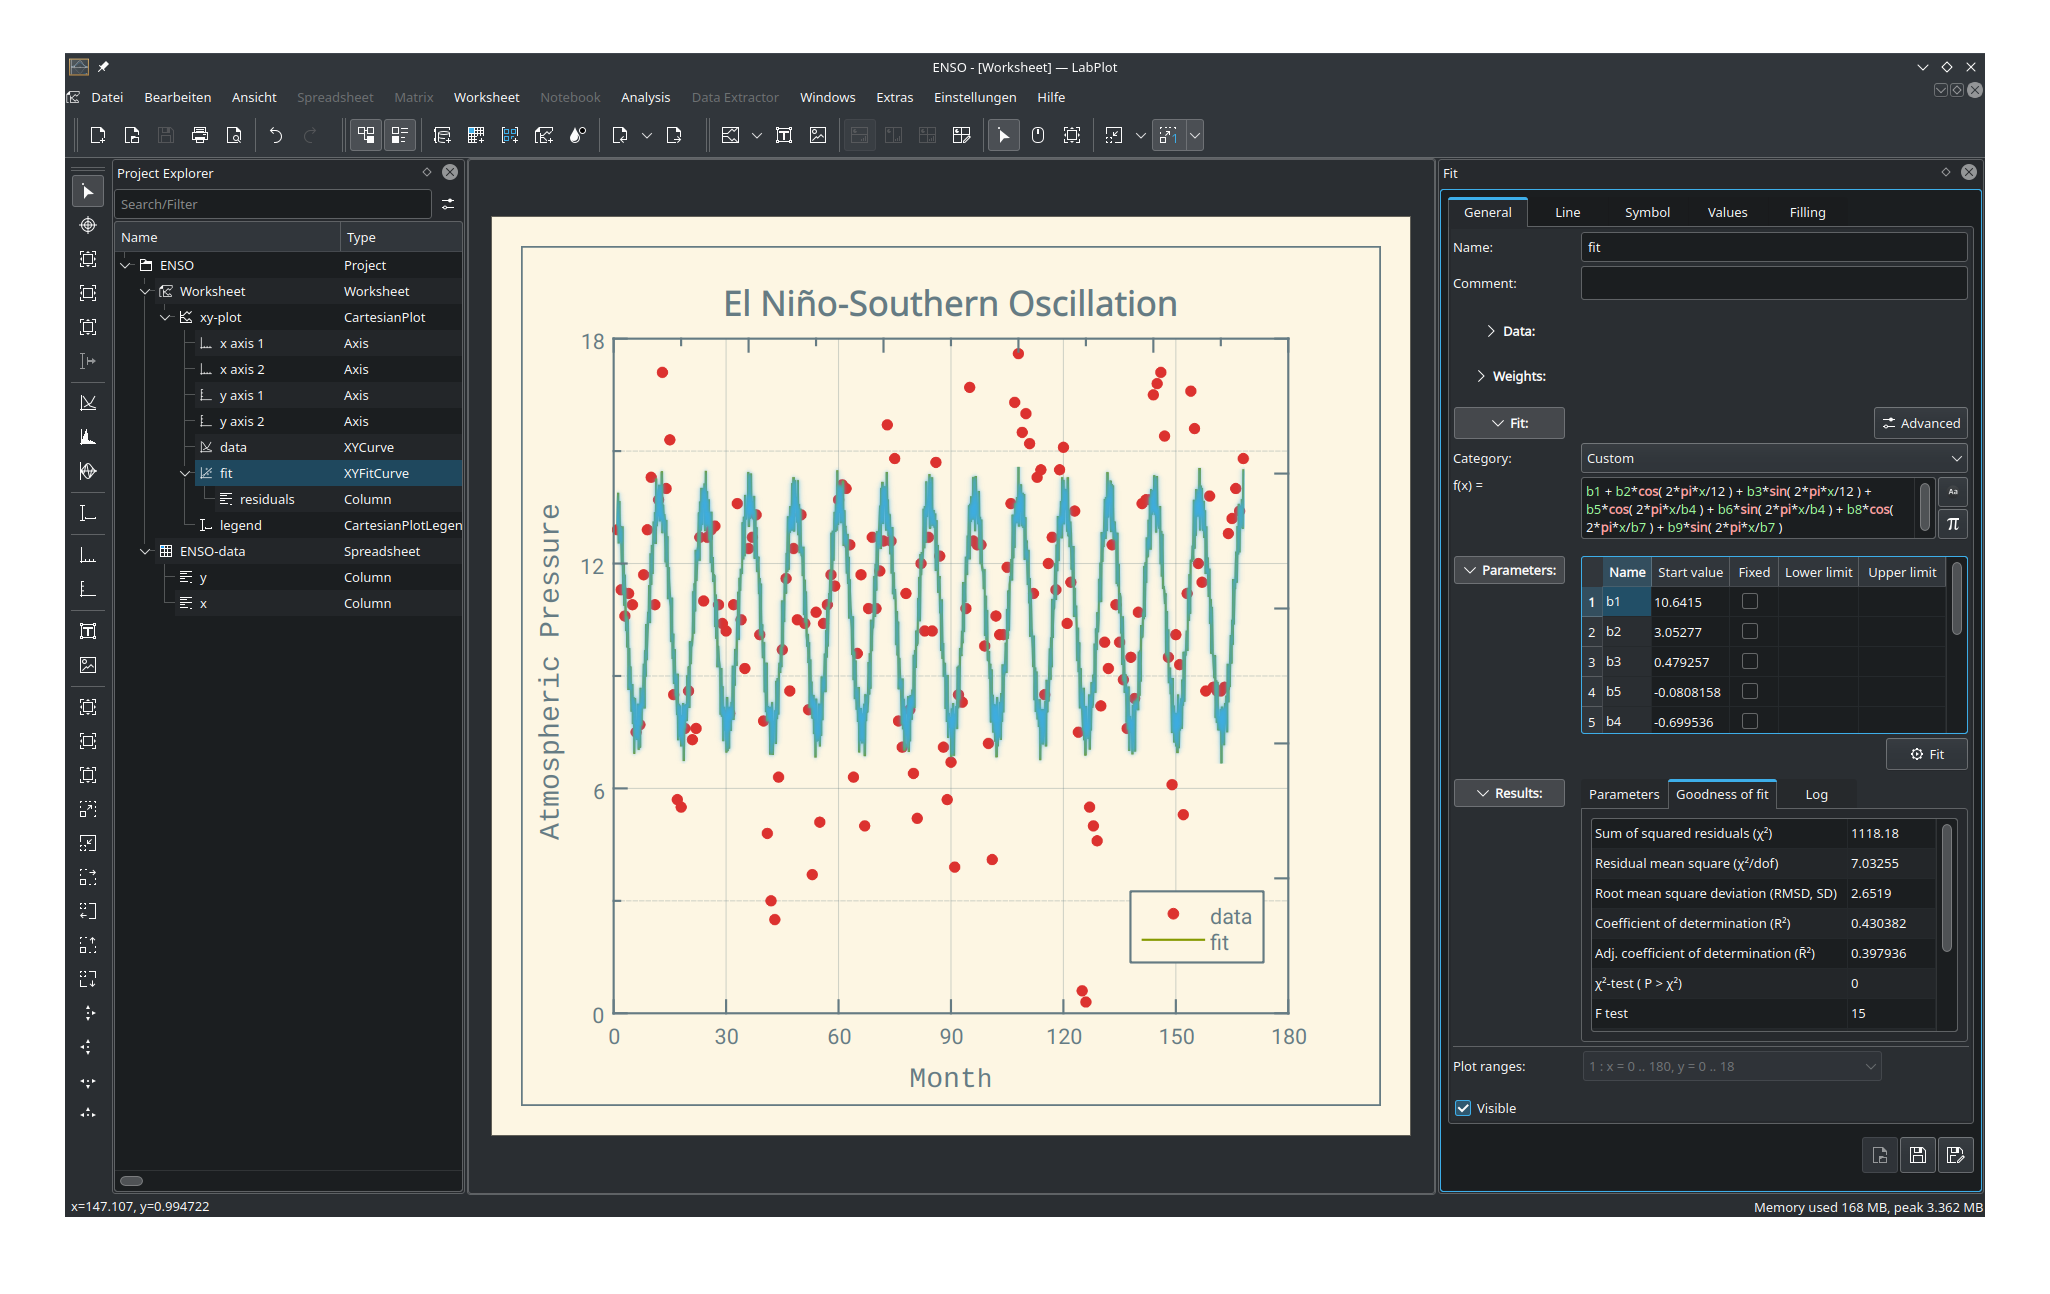
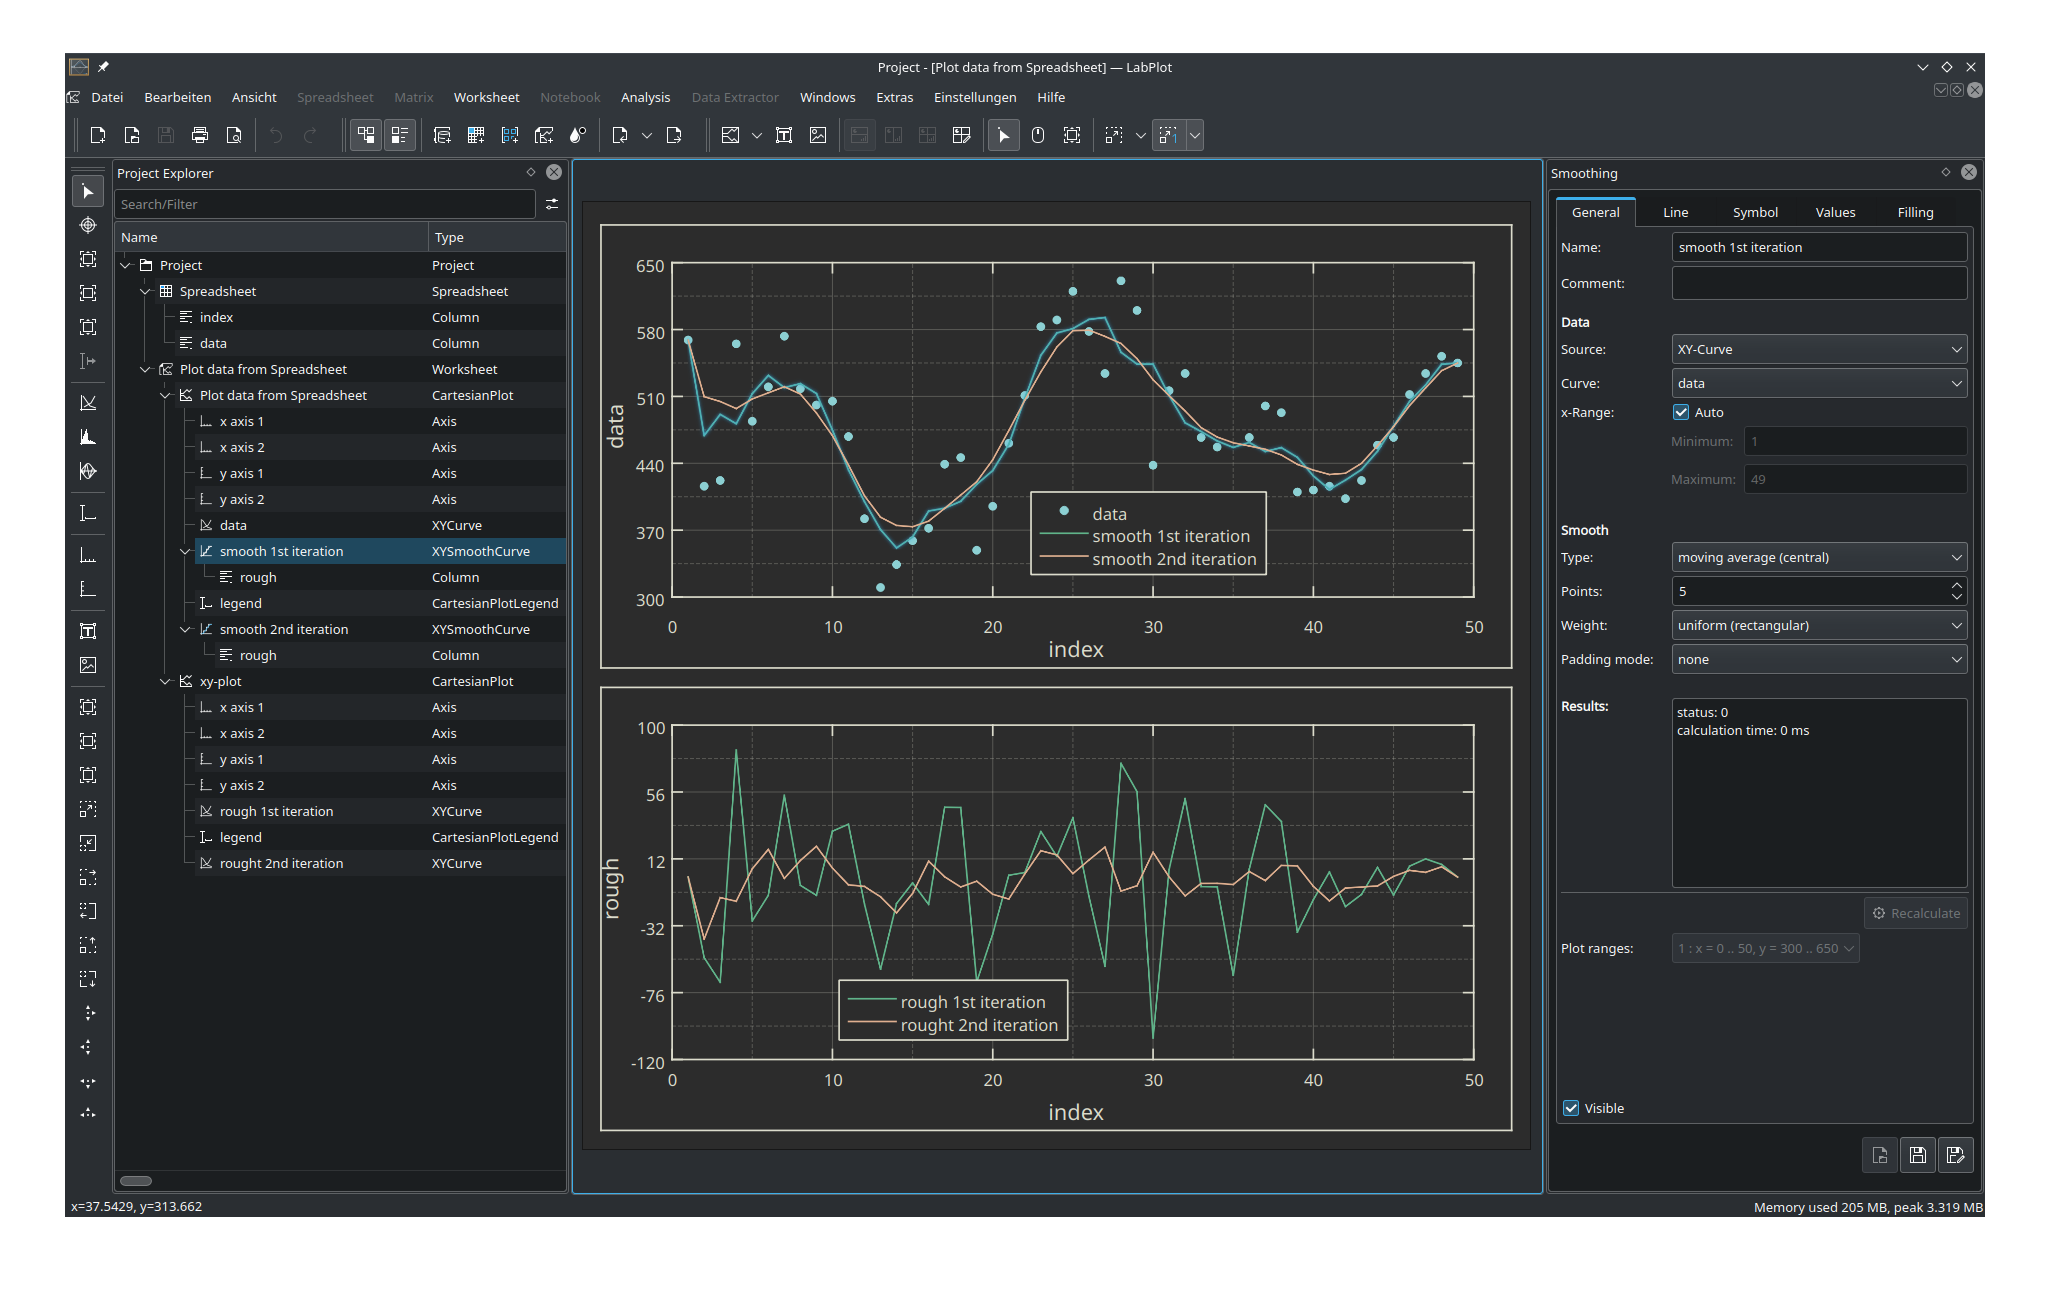
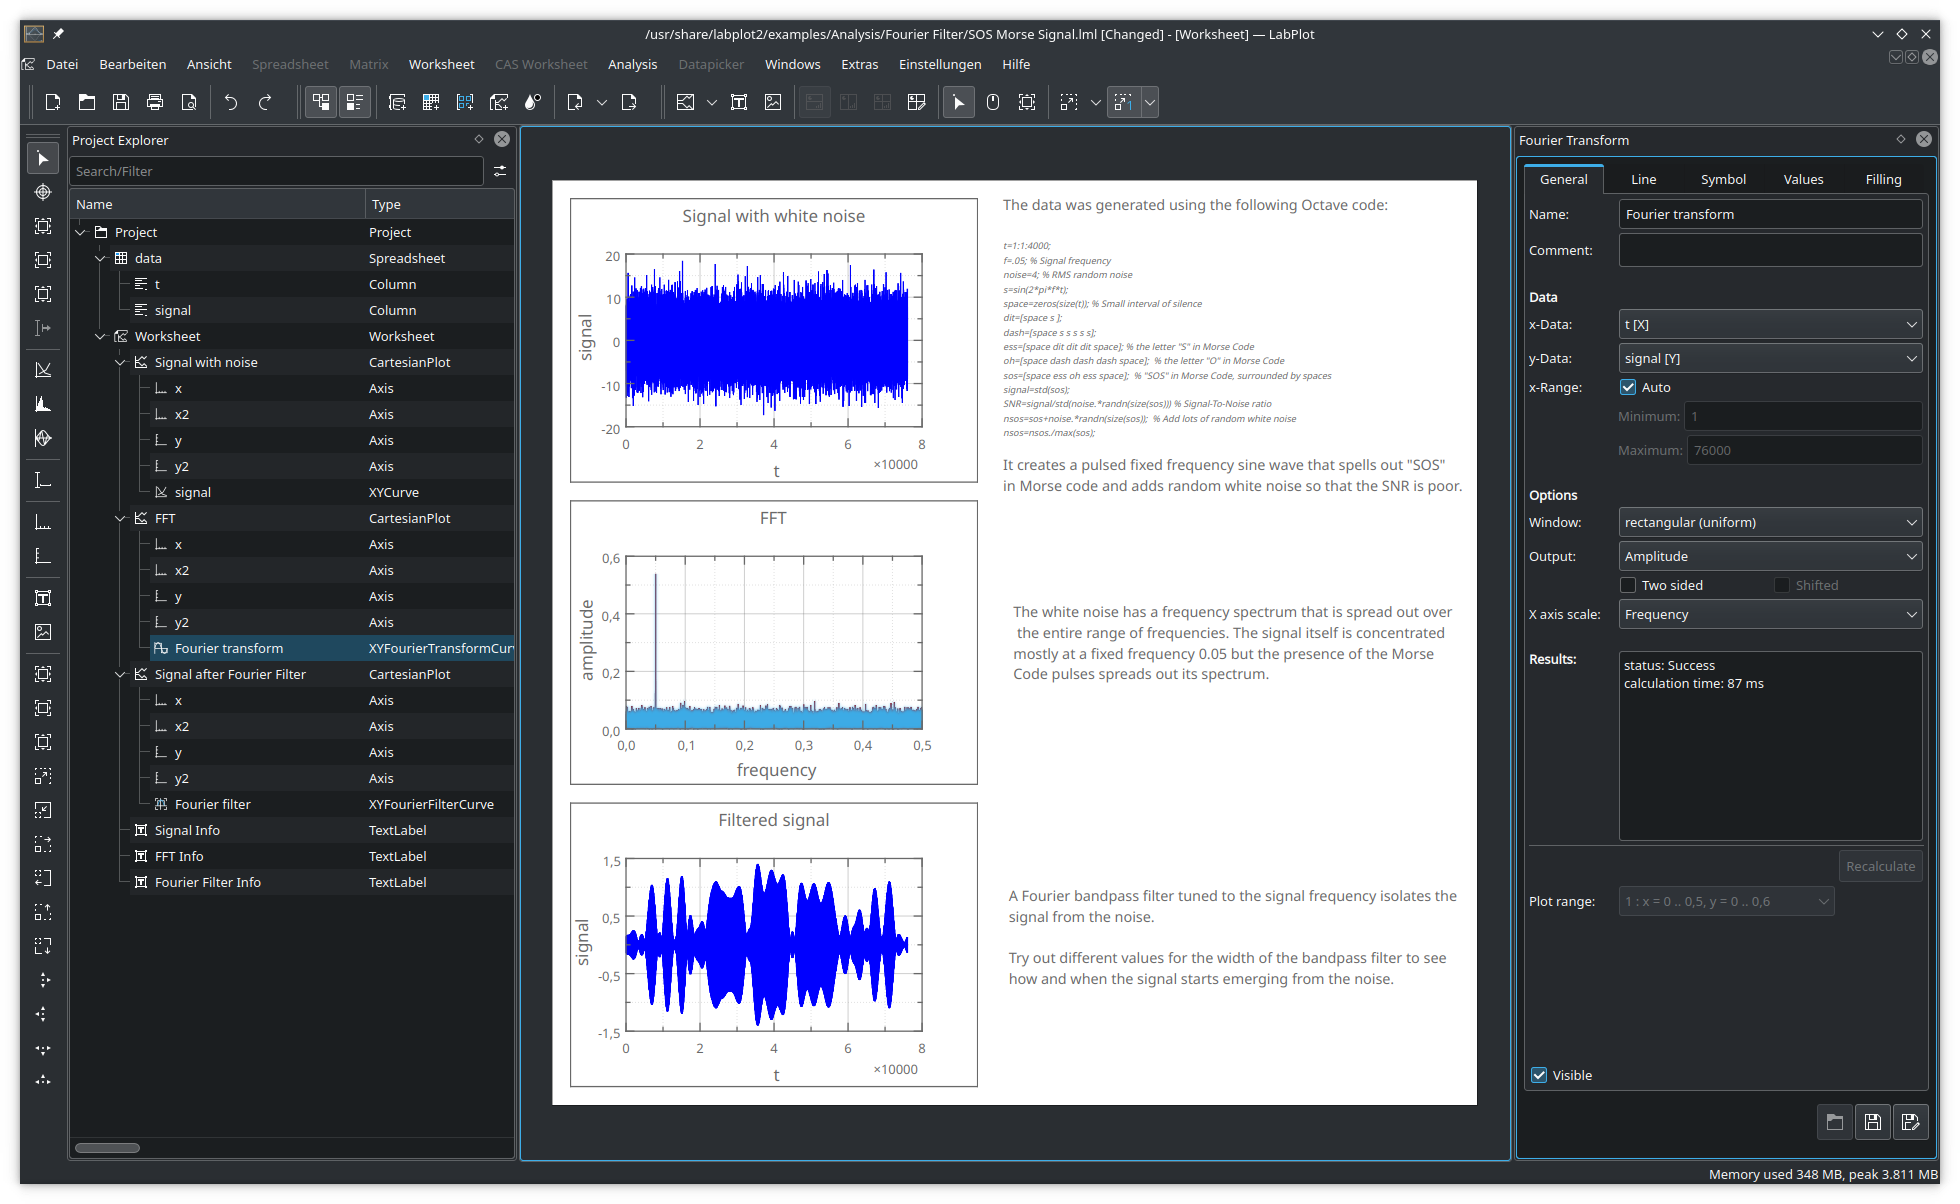
Reliable and easy data analysis, statistics, regression, curve and peak fitting
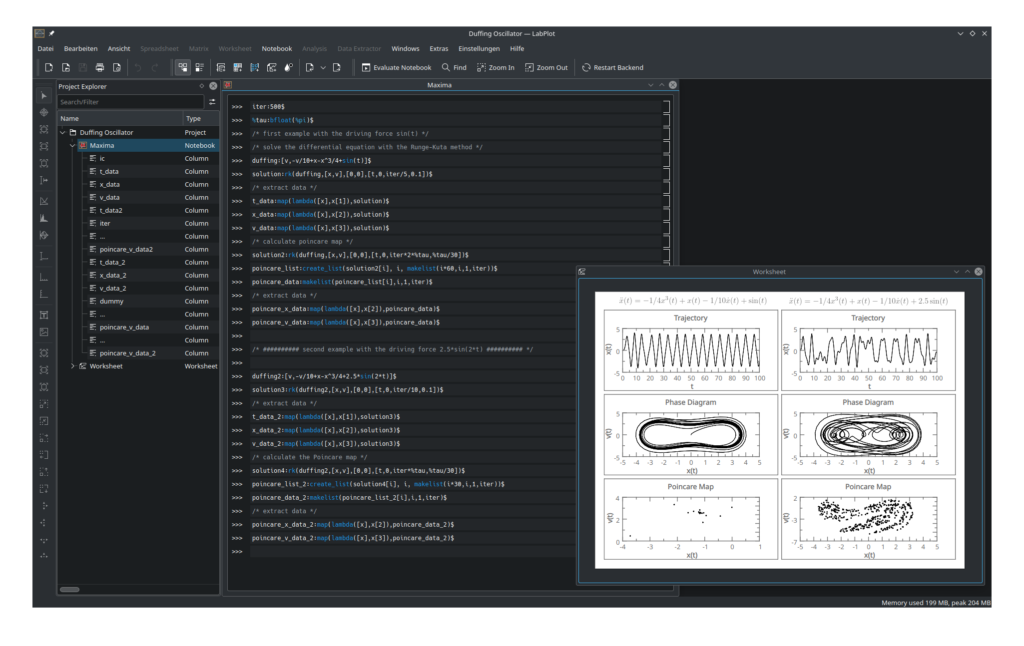
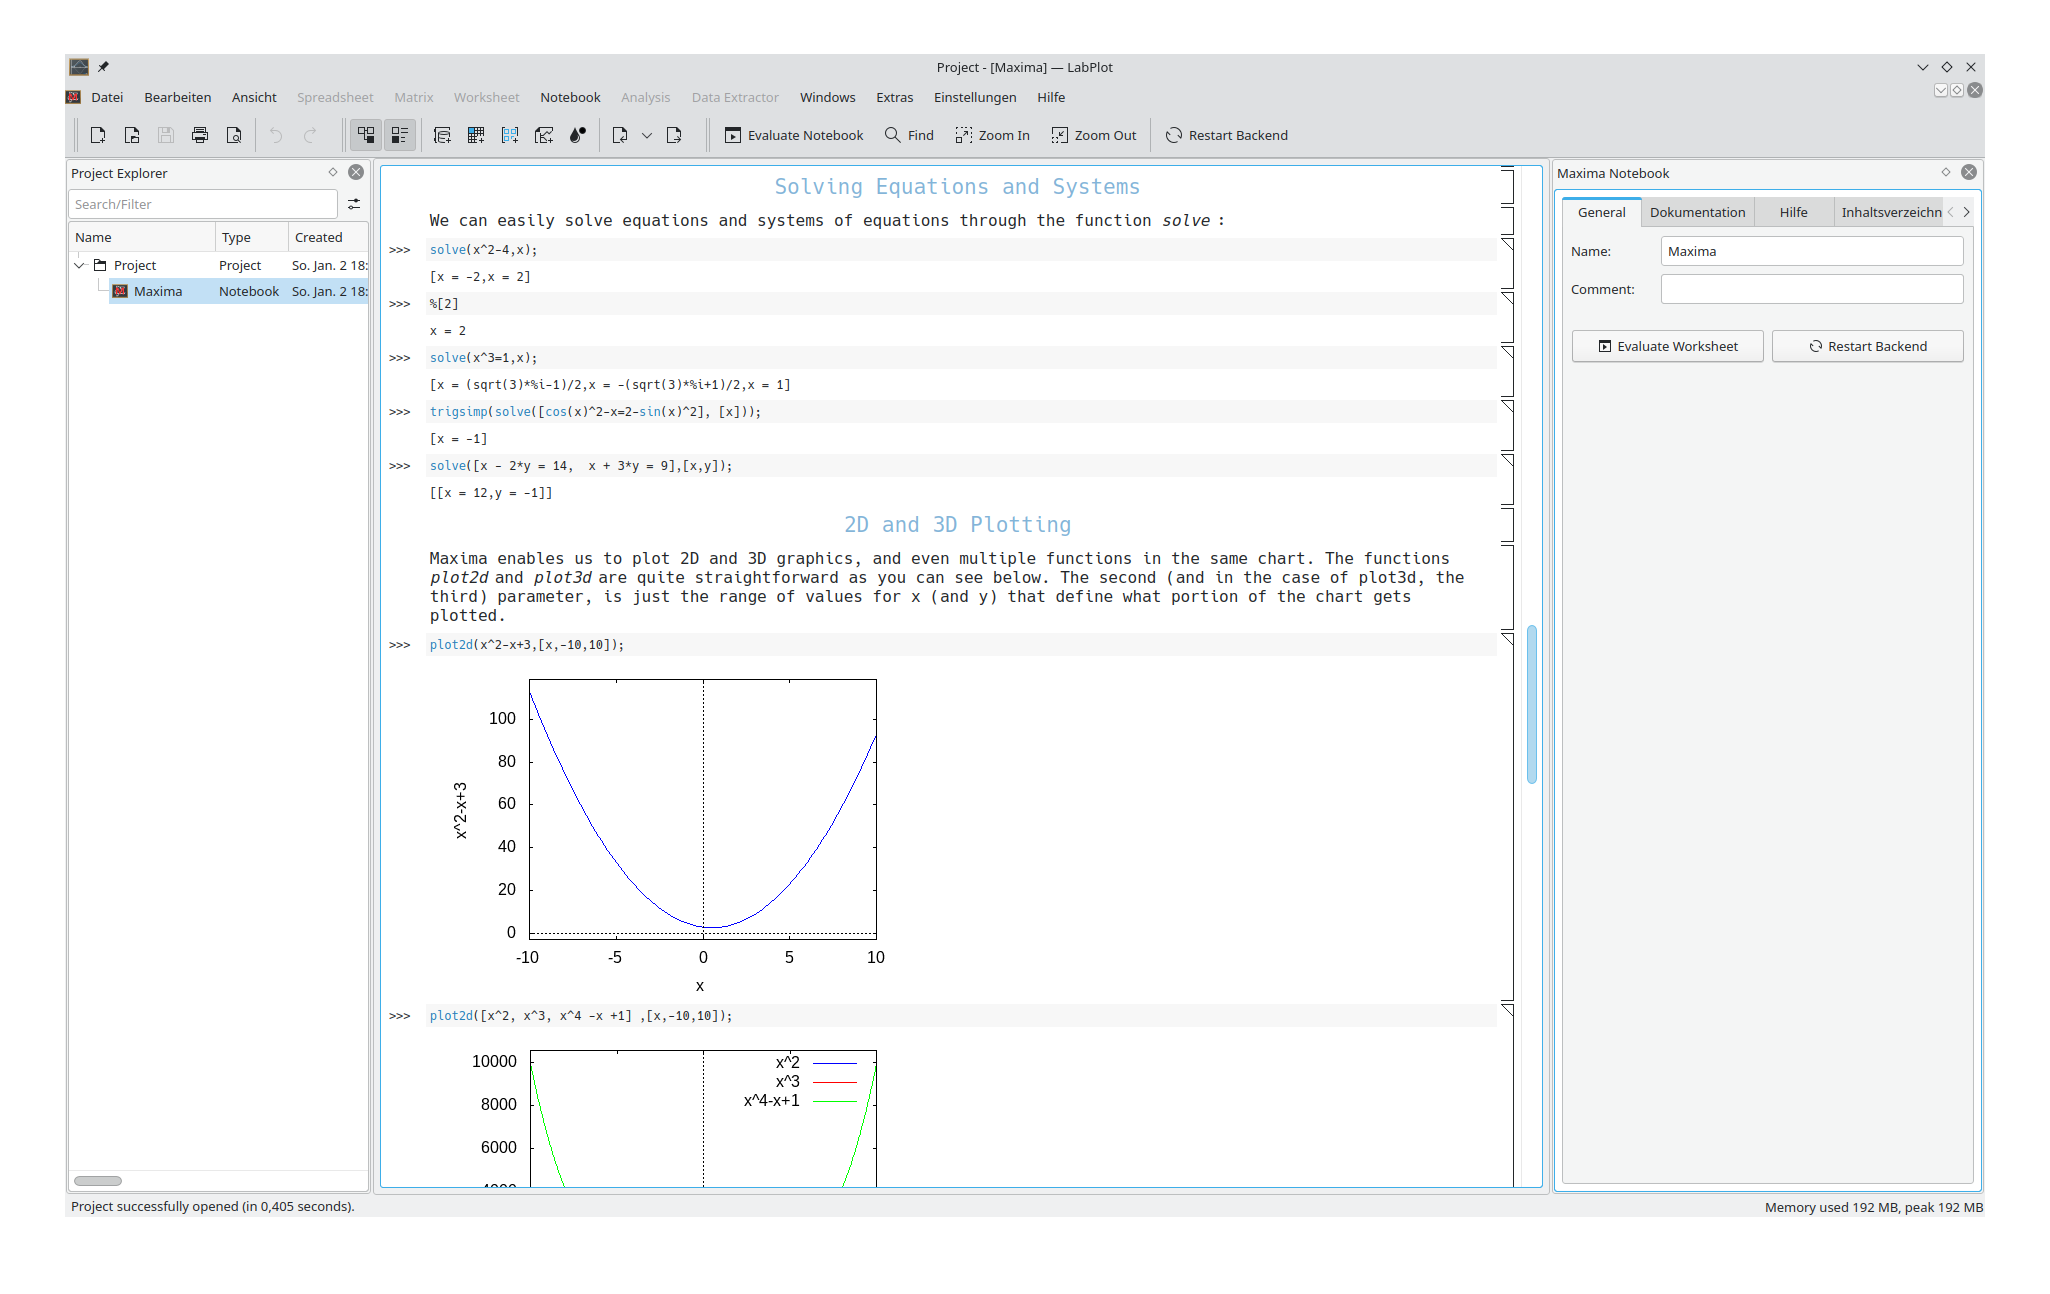
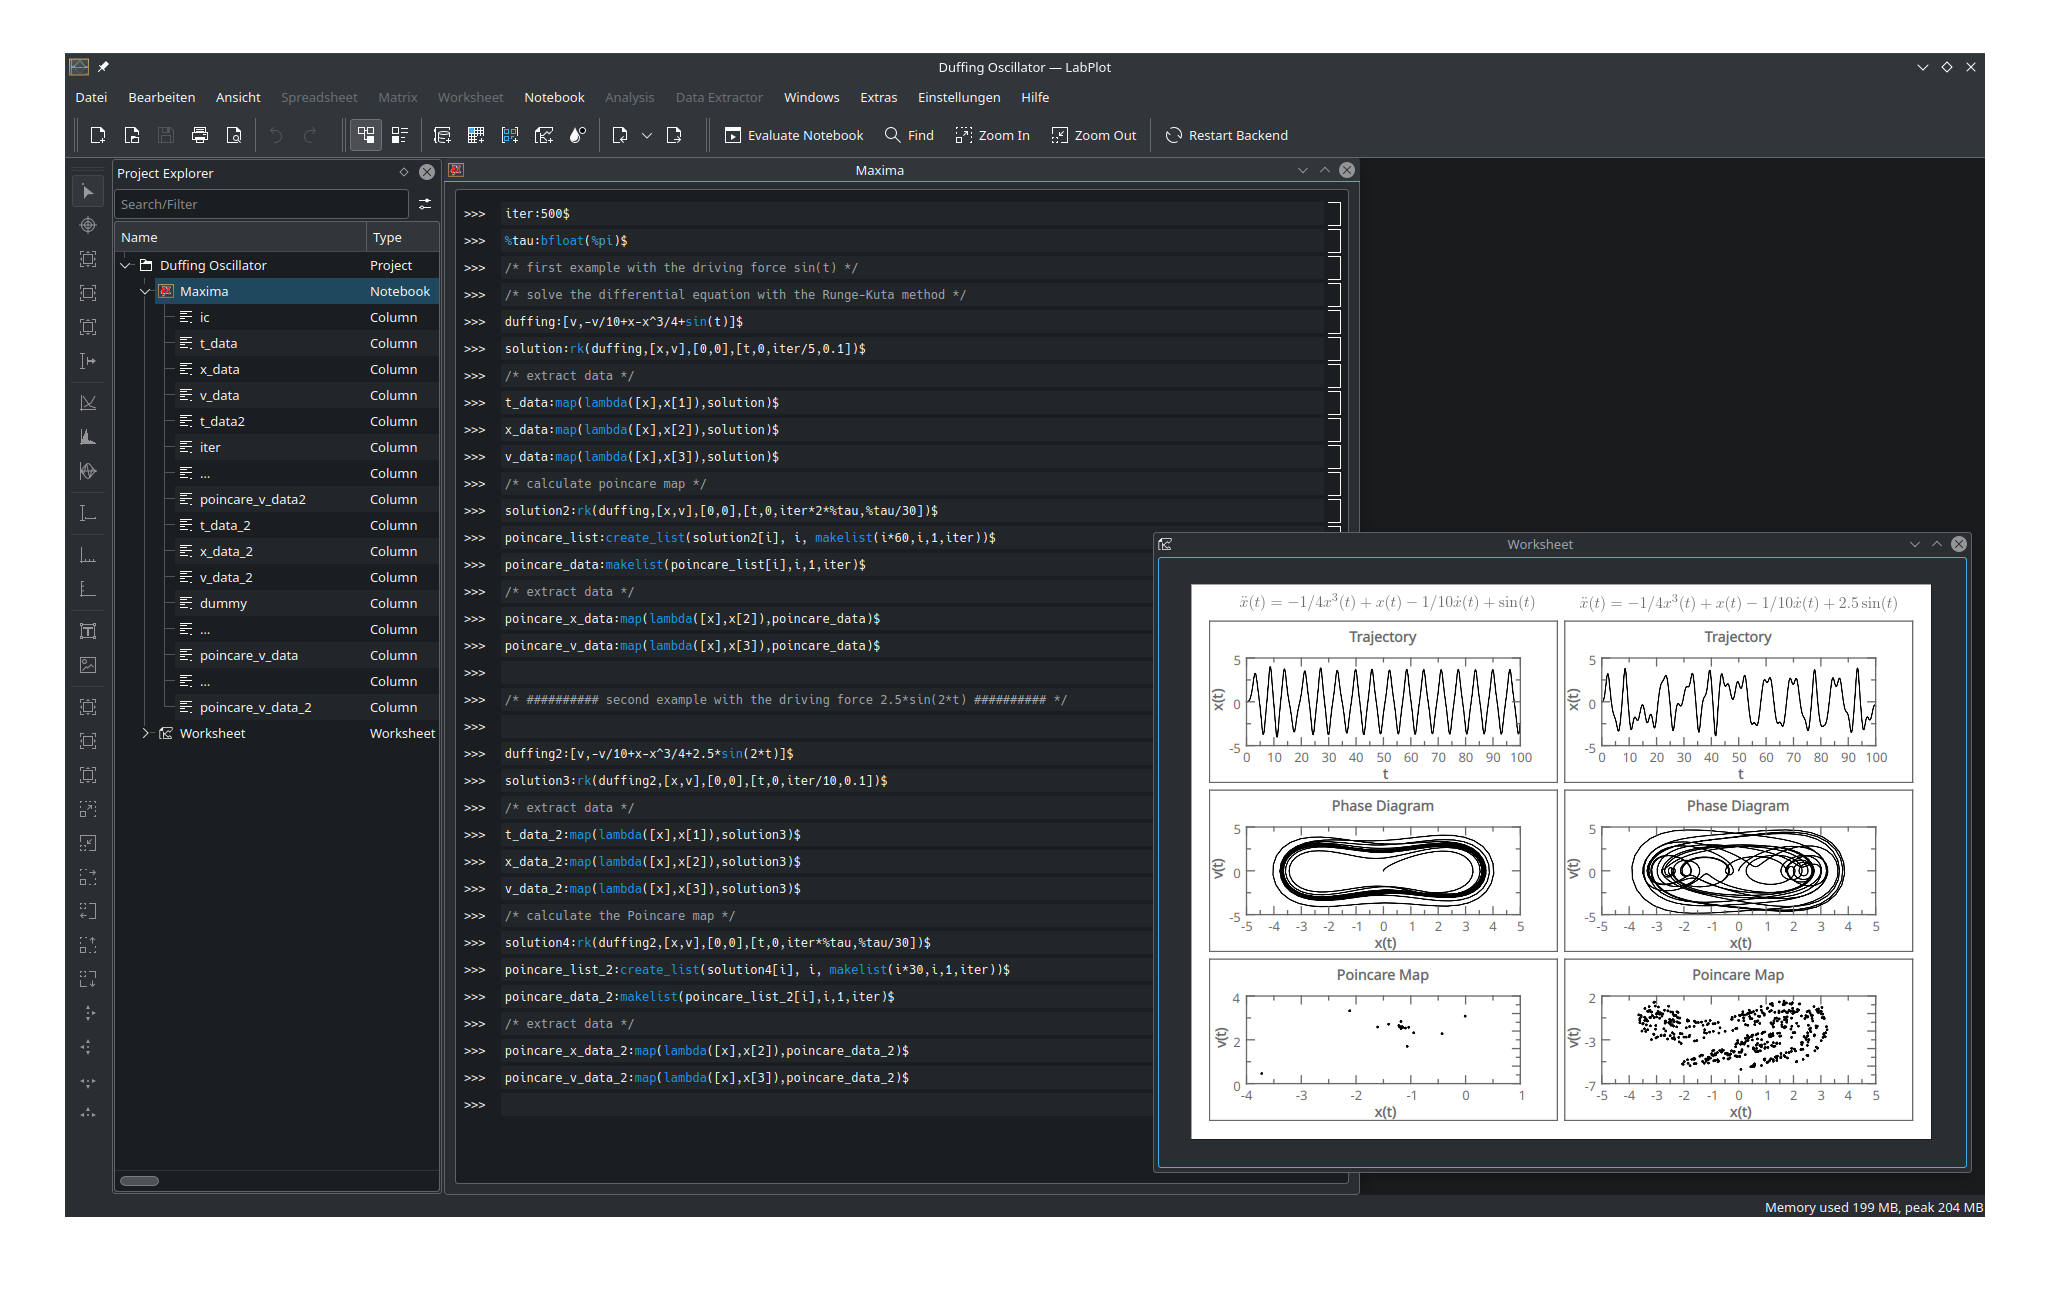
Intuitive and fast computing with interactive notebooks using Python, R, Julia etc.
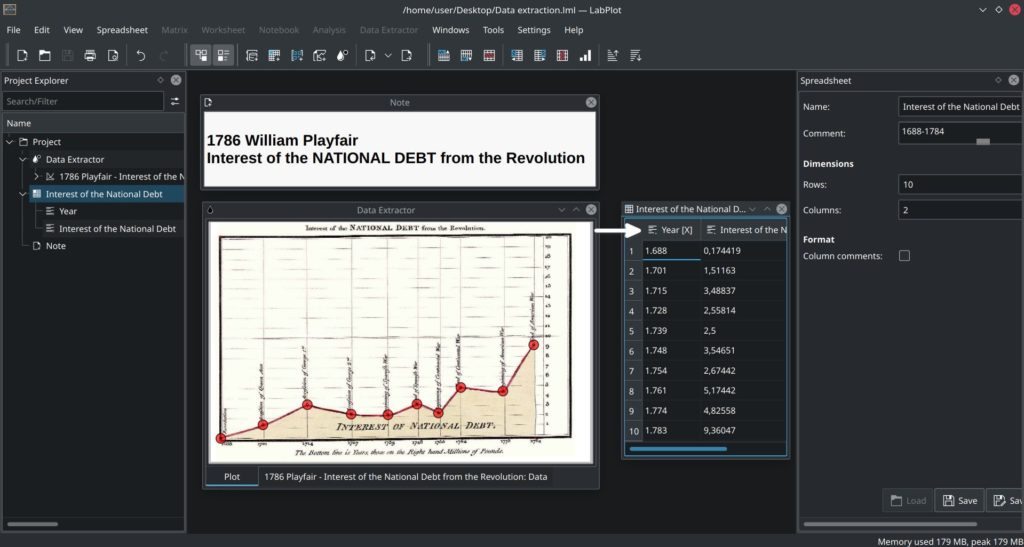
Effortless data extraction (plot digitizer) and support for real-time data
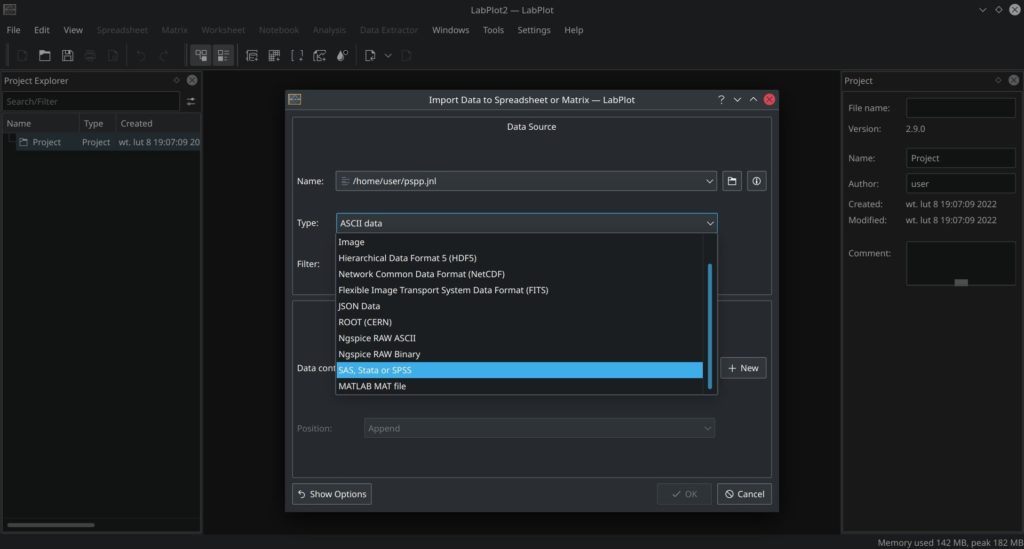
Smooth data import and export to and from multiple formats
Available for Windows, macOS, Linux, FreeBSD and Haiku with customizable theming
Latest News
Stay in touch with recent developments
An Update on our NGI Zero Core Funded Work
October 4, 2025 • Dariusz Laska
A few months ago, we announced that LabPlot had received funding from the NGI Zero Core fund. This was to help us focus on three features we’ve wanted …
Read more →LabPlot 2.12.1 released
August 18, 2025 • Alexander Semke
Today we are announcing the availability of the minor patch release 2.12.1. This release contains minor improvements and bug fixes only. The fixes are …
Read more →LabPlot 2.12 released
April 28, 2025 • Dariusz Laska
After many months of intense work, we are proud to announce the new release of LabPlot 2.12, a FREE, open source and cross-platform Data Visualization …
Read more →Gallery
Get a first impression of LabPlot's capabilities

Download
Like what you see and curious to try it out?